VECTOR GROUP LTD.
4400 Biscayne Blvd.
Miami, Florida 33137
NOTICE OF ANNUAL MEETING OF STOCKHOLDERS
To Be Held April 28, 201625, 2018
To the Stockholders of Vector Group Ltd.:
The Annual Meeting of Stockholders of Vector Group Ltd., a Delaware corporation (the “Company” or "Vector"“Vector”), will be held at the JW Marriott MarquisHilton Downtown Miami, 2551601 Biscayne Blvd Way,Boulevard, Miami, FL 3313133132 on Thursday,Wednesday, April 28, 201625, 2018 at 11:1:00 a.m.p.m., and at any postponement or adjournment thereof, for the following purposes:
1. To elect sevennine directors to hold office until the next annual meeting of stockholders and until their successors are elected and qualified;
2. To hold an advisory vote on executive compensation (the “say on pay vote”);
3. To ratify the appointment of Deloitte & Touche LLP as our independent registered public accounting firm for the year ending December 31, 2016;2018;
4. To consider a non-binding stockholder proposal that requests the Company adopt a "Proxy Access"“Proxy Access” By-Law; and
5. To transact such other business as properly may come before the meeting or any adjournments or postponements of the meeting.
Every holder of record of Common Stock of the Company at the close of business on March 1, 2016February 27, 2018 is entitled to notice of the meeting and any adjournments or postponements thereof and to vote, in person or by proxy, one vote for each share of Common Stock held by such holder. A list of stockholders entitled to vote at the meeting will be available to any stockholder for any purpose germane to the meeting during ordinary business hours from April 14, 201611, 2018 to April 28, 2016,25, 2018, at the headquarters of the Company located at 4400 Biscayne Boulevard, 10th Floor, Miami, Florida 33137. A proxy statement, form of proxy and the Company's Annual Report on Form 10-K for the year ended December 31, 20152017 are enclosed herewith.
| By Order of the Board of Directors, |

HOWARD M. LORBER |
| President and Chief Executive Officer |
Miami, Florida
March 25, 201612, 2018
| IT IS IMPORTANT THAT PROXIES BE RETURNED PROMPTLY. THEREFORE, WHETHER OR NOT YOU EXPECT TO ATTEND THE MEETING IN PERSON, PLEASE SIGN AND RETURN THE ENCLOSED PROXY AS SOON AS POSSIBLE IN THE ENCLOSED POSTAGE PRE-PAID ENVELOPE. | |
VECTOR GROUP LTD.
4400 Biscayne Boulevard
Miami, Florida 33137
PROXY STATEMENT
INTRODUCTION
The board of directors of Vector Group Ltd., a Delaware corporation (the “Company” or "Vector"“Vector”) is soliciting the proxy accompanying the proxy statement for use at the annual meeting of stockholders to be held at the JW Marriott MarquisHilton Downtown Miami, 2551601 Biscayne Blvd Way,Boulevard, Miami, FL 3313133132 on Thursday,Wednesday, April 28, 201625, 2018, at 11:1:00 a.m.p.m., and at any postponement or adjournment. The Company’s offices are located at 4400 Biscayne Boulevard, 10th Floor, Miami, Florida 33137, and its telephone number is (305) 579-8000.
VOTING RIGHTS AND SOLICITATION OF PROXIES
Every holder of record of Common Stock of the Company at the close of business on March 1, 2016February 27, 2018 is entitled to notice of the meeting and any adjournments or postponements and to cast, in person or by proxy, one vote for each share of Common Stock held by such holder. At the record date, the Company had outstanding 123,792,329134,365,424 shares of Common Stock. This
To expedite delivery, reduce our costs and decrease the environmental impact of our proxy statement, accompanying noticematerials, we used “Notice and Access” in accordance with an SEC rule that permits us to provide proxy andmaterials to our stockholders over the Company’sInternet. By March 16, 2018, we sent a Notice of Internet Availability of Proxy Materials to certain of our stockholders containing instructions on how to access our proxy materials online. Our Notice of Annual Meeting of Stockholders, Proxy Statement, form of Electronic Proxy Card and Annual Report on Form 10-K are available for viewing online at http://www.astproxyportal.com/ast/03819/. If you received a Notice, you will not receive a printed copy of the fiscal year ended December 31, 2015 are first being mailedproxy materials in the mail. Instead, the Notice instructs you on how to stockholdersaccess and review all of the important information contained in the proxy materials. The Notice also instructs you on how you may submit your proxy via the Internet. If you received a Notice and would like to receive a copy of our proxy materials, follow the instructions contained in the Notice to request a copy electronically or in paper form on a one-time or ongoing basis. Stockholders who do not receive the Notice will continue to receive either a paper or electronic copy of our Proxy Statement and 2017 Annual Report to Stockholders, which will be sent on or aboutbefore March 31, 2016.16, 2018.
Any stockholder who has given a proxy has the power to revoke the proxy prior to its exercise. A proxy can be revoked by an instrument of revocation delivered at, or prior to the annual meeting, to Marc N. Bell, the secretary of the Company, by a duly executed proxy bearing a date or time later than the date or time of the proxy being revoked, or at the annual meeting if the stockholder is present and elects to vote in person. Mere attendance at the annual meeting will not serve to revoke a proxy. A stockholder whose shares are held in a brokerage or bank account will need to obtain a legal proxy from the broker, bank or other intermediary in order to vote at the meeting.
The presence, in person or represented by proxy, of the holders of a majority of the issued and outstanding shares of Common Stock will constitute a quorum for the transaction of business at the annual meeting. The affirmative vote of holders of a plurality of the shares represented and entitled to vote is required for the election of each director. The affirmative vote of the holders of a majority of the shares represented and entitled to vote at the meeting is required for the advisory approval of the say on pay vote, the ratification of the appointment of Deloitte & Touche LLP as the Company’s independent registered public accounting firm and the stockholder's non-binding proposal, and abstentions will have the effect of votes against each such matter.
Except for the ratification of the auditors, shares that are held by brokers in retail accounts may only be voted if the broker receives voting instructions from the beneficial owner of the shares. Otherwise, the “broker non-votes” may only be counted toward a quorum and, in the broker’s discretion, voted regarding the ratification of auditors. Broker non-votes will have no effect on any of the other matters presented at the annual meeting.
All proxies received and not revoked will be voted as directed. If no directions are specified, proxies which have been signed and returned will be voted “FOR”“FOR” the election of the board’s nominees as directors, “FOR”“FOR” the advisory say on pay vote, “FOR”“FOR” the ratification of Deloitte & Touche LLP as the Company’s independent registered public accounting firm and "AGAINST""AGAINST" the stockholder's non-binding proposal requesting the Company adopt a "Proxy Access" By-Law.
SECURITY OWNERSHIP OF CERTAIN BENEFICIAL OWNERS AND MANAGEMENT
The following table sets forth, as of the record date, the beneficial ownership of the Company’s Common Stock, the only class of voting securities, by:
each person known to the Company to own beneficially more than five percent of the Common Stock;
each of the Company’s directors and nominees;
each of the Company’s named executive officers shown in the Summary Compensation Table below; and
all directors and executive officers as a group.
Unless otherwise indicated, each person possesses sole voting and investment power with respect to the shares indicated as beneficially owned.
Name and Address of Beneficial Owner | Number of Shares | Percent of Class | ||||
Dr. Phillip Frost (1) 4400 Biscayne Boulevard Miami, FL 33137 | 18,777,735 | 15.2 | % | |||
Bennett S. LeBow (2) (4) 667 Madison Avenue; 14th Floor New York, NY 10065 | 8,980,081 | 7.3 | % | |||
Howard M. Lorber (3) (4) (5) 4400 Biscayne Boulevard Miami, FL 33137 | 7,459,241 | 5.9 | % | |||
The Vanguard Group, Inc. 100 Vanguard Blvd. Malvern, PA 19355 (6) | 6,764,240 | 5.5 | % | |||
| Stanley S. Arkin (4) | 19,675 | (*) | ||||
| Henry C. Beinstein (4) (7) | 99,332 | (*) | ||||
| Jeffrey S. Podell (4) | 82,304 | (*) | ||||
| Jean E. Sharpe (4) (8) | 104,228 | (*) | ||||
| Richard J. Lampen (5) (9) (10) | 468,128 | (*) | ||||
| J. Bryant Kirkland III (5) (11) | 217,457 | (*) | ||||
| Marc N. Bell (5) (11) | 142,302 | (*) | ||||
| Ronald J. Bernstein (4) (5) (12) | 81,440 | (*) | ||||
| All directors and executive officers as a group (10 persons) | 17,654,188 | 14.0 | % | |||
Name and Address of Beneficial Owner | Number of Shares | Percent of Class | ||||
Dr. Phillip Frost (1) 4400 Biscayne Boulevard Miami, FL 33137 | 20,498,697 | 15.3 | % | |||
The Vanguard Group, Inc. (2) 100 Vanguard Blvd. Malvern, PA 19355 | 9,572,269 | 7.1 | % | |||
Renaissance Technologies LLC (3) 800 Third Avenue New York, NY 10022 | 8,743,448 | 6.5 | % | |||
Bennett S. LeBow (4) (6) 667 Madison Avenue; 14th Floor New York, NY 10065 | 7,785,306 | 5.8 | % | |||
Howard M. Lorber (5) (6) (7) 4400 Biscayne Boulevard Miami, FL 33137 | 7,605,777 | 5.6 | % | |||
| Stanley S. Arkin (6) | 32,715 | (*) | ||||
| Henry C. Beinstein (6) (8) | 120,506 | (*) | ||||
| Paul V. Carlucci (6) | — | (*) | ||||
| Jeffrey S. Podell (6) | 91,262 | (*) | ||||
| Jean E. Sharpe (6) (9) | 125,932 | (*) | ||||
| Barry Watkins (6) | — | (*) | ||||
| Richard J. Lampen (7) (10) (11) | 709,761 | (*) | ||||
| J. Bryant Kirkland III (7) (12) | 381,045 | (*) | ||||
| Marc N. Bell (7) (13) | 266,279 | (*) | ||||
| Ronald J. Bernstein (6) (14) | 89,784 | (*) | ||||
| All directors and executive officers as a group (12 persons) | 17,208,367 | 12.5 | % | |||
___________________________
(*) The percentage of shares beneficially owned does not exceed 1% of the outstanding Common Stock.
| (1) | Based upon |
| (2) | Based on Schedule 13-G/A filed by The Vanguard Group, Inc. (“Vanguard”) with the Securities and Exchange Commission (“SEC”) on February 9, 2018. Includes 140,816 shares, where Vanguard has sole voting and dispositive power, owned by Fiduciary Trust Company, a wholly-owned subsidiary of Vanguard, and 28,461 shares, where Vanguard has sole voting power, owned by Vanguard Investments Australia, Ltd., a wholly-owned subsidiary of Vanguard. |
| (3) | Based on Schedule 13-G filed by Renaissance Technologies LLC and Renaissance Technologies Holding Corporation with the SEC on February 13, 2018. |
| (4) | Includes |
| Includes |
| The named individual is a director of the Company. |
| The named individual is an executive officer of the Company. |
| Includes |
| Includes |
| Includes |
| Includes 227,588 shares issuable upon exercise of outstanding options to purchase Common Stock exercisable within 60 days of record date. |
| (14) | The named individual is an executive officer of the Company’s subsidiaries Liggett Vector Brands LLC and Liggett Group LLC. |
EXECUTIVE OFFICERS OF THE COMPANY
Information regarding each of the executive officers of the Company, including name, age, positions and offices held with the Company, and term of office as an officer of the Company, is provided in Item 5 of the Company’s Annual Report on Form 10-K for the fiscal year ended December 31, 2015.2017.
BOARD PROPOSAL 1 — NOMINATION AND ELECTION OF DIRECTORS
The by-laws of the Company provide, among other things, that the board, from time to time, shall determine the number of directors of the Company. The size of the board is presently set at seven.nine. The present term of office of all directors will expire at the 20162018 annual meeting. SevenNine directors are to be elected at the 20162018 annual meeting to serve until the next annual meeting of stockholders and until their respective successors are duly elected and qualified or until their earlier resignation or removal.
It is intended that proxies received will be voted “FOR” election of the nominees named below unless marked to the contrary. In the event any such person is unable or unwilling to serve as a director, proxies may be voted for substitute nominees designated by the present board. The board has no reason to believe that any of the persons named below will be unable or unwilling to serve as a director if elected.
The affirmative vote of the holders of a plurality of the shares represented at the annual meeting and entitled to vote on the election of directors is required to elect each director.
The Board of Directors recommends that stockholders vote “FOR” election of the nominees named below.
Information with Respect to Nominees
The following table sets forth certain information, as of the record date, with respect to each of the nominees. Each nominee is a citizen of the United States.
| Name and Address | Age | Principal Occupation | ||
| Bennett S. LeBow | Chairman of the Board; Private Investor | |||
Howard M. Lorber | President and Chief Executive Officer | |||
Ronald J. Bernstein | President and Chief Executive Officer, Liggett Group LLC and Liggett Vector Brands LLC | |||
| Stanley S. Arkin | Founding and Senior Partner, Arkin Solbakken LLP and Chairman of The Arkin Group LLC | |||
Henry C. Beinstein | Partner, Gagnon Securities LLC | |||
| Paul V. Carlucci | 70 | Private Investor | ||
Jeffrey S. Podell | Private Investor | |||
Jean E. Sharpe | Private Investor | |||
| Barry Watkins | 53 | Of Counsel, DKC, and Senior Advisor, Madison Square Garden Company | ||
Business Experience and Qualifications of Nominees
The Company believes that the combination of the various qualifications, skills and experiences of its directors contribute to an effective and well-functioning board and that individually and, as a whole, the directors possess the necessary qualifications to provide effective oversight of the business, and provide quality advice to the Company’s management. Details regarding the experience and qualifications of the directors are set forth below.
Bennett S. LeBow is the Chairman of the Company’s Board of Directors and has been a director of the Company since October 1986. Mr. LeBow, currently a private investor, served as the Company's Chairman and Chief Executive Officer from June 1990 to December 2005 and Executive Chairman from January 2006 until his retirement on December 30, 2008. He has served as Chairman of the Board of Signal Genetics Inc. (NASDAQ: SGNL) sincefrom January 2010.2010 to February 2017, when it was acquired by Miragen Therapeutics, Inc. (NASDAQ: MGEN). Mr. LeBow served as Chairman of the Board of Directors of Borders Group Inc. from May 2010 until January 2012 and, from June 2010 until January 2012, as Chief Executive Officer of Borders Group Inc., which filed for protection under Chapter 11 of Title 11 of the United States Bankruptcy Code in February 2011. Mr. LeBow was Chairman of the Board of New Valley Corporation (“New Valley”) from January 1988 to December 2005 and served as its Chief Executive Officer from November 1994 to December 2005. New Valley Corporation was a majority-owned subsidiary of the Company until December 2005, when the Company acquired the remaining minority interest, became engaged in the real estate business and began seeking to acquire additional operating companies and real estate properties. Mr. LeBow’s pertinent experience, qualifications, attributes and skills include his decades of experience as an investor and the knowledge and experience in the cigarette industry he has attained through his service as the Company's Chief Executive Officer from 1990 to 2005 and as Chairman of the Board since 1990.
Howard M. Lorber has been President and Chief Executive Officer of the Company since January 2006. He served as President and Chief Operating Officer of the Company from January 2001 to December 2005 and has served as a director of the Company since January 2001. He has also served as Chairman of the Board of Directors since 1987 and Chief Executive Officer from November 1993 to December 2006 of Nathan’s Famous, Inc. (NASDAQ: NATH), a chain of fast food restaurants; Chairman of the Board of Ladenburg Thalmann Financial Services (NYSE MKT:American: LTS) from May 2001 to July 2006 and Vice Chairman since July 20062006; and as a director of Clipper Realty Inc. (NYSE: CLPR) since July 2015. Mr. Lorber was a member of the Board of Directors since March 2015 and Chairman since May 2015 of Morgans Hotel Group Co. (NASDAQ: MHGC). Mr. Lorber was a Director of Borders Group Inc. from March 2015 until November 2016 and served as Chairman from May 2010 until January 2012 and has been a director since 1991 of United Capital Corp., a real estate investment and diversified manufacturing company, which ceased2015 to be a public reporting company in 2011.November 2016. From November 1994 to December 2005, Mr. Lorber served as President and Chief Operating Officer of New Valley, where he also served as a director. Mr. Lorber was Chairman of the Board of Hallman & Lorber Assoc., Inc., consultants and actuaries of qualified pension and profit sharing plans, and various of its affiliates from 1975 to December 2004 and has been a consultant to these entities since January 2005. He is also a trustee of Long Island University. Mr. Lorber's pertinent experience, qualifications, attributes and skills include the knowledge and experience in the real estate and cigarette industry he has attained through his service as our President and a member of our Board of Directors since 2001 as well as his service as a director of other publicly-traded corporations.
Ronald J. Bernstein has served as President and Chief Executive Officer of Liggett Group LLC, an indirect subsidiary of the Company, since September 1, 2000 and of Liggett Vector Brands LLC, an indirect subsidiary of the Company, since March 2002 and has been a director of the Company since March 2004. From July 1996 to December 1999, Mr. Bernstein served as General Director and, from December 1999 to September 2000, as Chairman of Liggett-Ducat Ltd., the Company’s former Russian tobacco business sold in 2000. Prior to that time, Mr. Bernstein served in various positions with Liggett commencing in 1991, including Executive Vice President and Chief Financial Officer. Mr. Bernstein’s pertinent experience, qualifications, attributes and skills include the knowledge and experience in the cigarette industry, which is the primary contributor to the Company's earnings, he has attained through his employment by our tobacco and real estate subsidiaries since 1991.
Stanley S. Arkin has been a director since November 2011. Mr. Arkin is the founding member and the senior partner of the law firm of Arkin Solbakken LLP and is Chairman of The Arkin Group, a private intelligence agency. Mr. Arkin was a member of the Board of Directors of Authentic Fitness Corp, a fitness apparel company that ceased to be publicly traded in 1999, from 1995 to 1998. He is a member of the Council on Foreign Relations, and has served on or chaired numerous committees in other professional organizations, such as the American College of Trial Lawyers, the Judicial Conference of the State of New York, the Association of the Bar of the City of New York, the American Bar Association, the New York State Bar Association, and the New York County Lawyers Association. Mr. Arkin’s pertinent experience, qualifications, attributes and skills include his managerial experience, financial literacy and the knowledge and experience he has attained through his career in the legal profession as well as his service as a director of a publicly-traded corporation.
Henry C. Beinstein has been a director of the Company since March 2004. Since January 2005, Mr. Beinstein has been a partner of Gagnon Securities LLC, a broker-dealer and FINRA member firm, and has been a money manager and registered representative at such firm since August 2002. He retired in August 2002 as the Executive Director of Schulte Roth & Zabel LLP, a New York-based law firm, a position he had held since August 1997. Before that, Mr. Beinstein had served as the Managing Director of Milbank, Tweed, Hadley & McCloy LLP, a New York-based law firm, commencing November 1995. Mr. Beinstein was the Executive Director of Proskauer Rose LLP, a New York-based law firm, from April 1985 through October 1995. Mr. Beinstein is a certified public accountant in New York and prior to joining Proskauer was a partner and National Director of Finance and Administration at Coopers & Lybrand. He also holds the designation of Chartered Global Management Accountant from the American Institute of Certified Public Accountants. Mr. Beinstein also serves as a director of Ladenburg Thalmann Financial Services Inc. (NYSE MKT:American: LTS) and Castle Brands Inc. (NYSE MKT:American: ROX) (“Castle”). Mr. Beinstein has been licensed as a Certified Public Accountant in the state of New York since 1968. Mr. Beinstein’s pertinent experience, qualifications, attributes and skills include financial literacy and expertise, managerial experience through his years at Coopers & Lybrand, Proskauer Rose LLP, Milbank, Tweed, Hadley & McCloy LLP and Schulte Roth & Zabel LLP, and the knowledge and experience he has attained through his service as a director of the Company and other publicly-traded corporations.
Paul V. Carlucci has been a director of the Company since March 2018 and was the Chairman and Chief Executive Officer of News America Marketing, a subsidiary of News Corporation (NASDAQ: NWSA) and a single-source provider of consumer advertising and promotional services, from October 1997 until his retirement in June 2014. He also served as publisher of the New York Post from September 2005 to September 2012 and was a member of the Executive Committee of News Corporation from October 1996 until his retirement in June 2014. He continued to consult to News Corporation until June 2017. He was also President and CEO of News America Publishing, Inc. (the parent company of TV Guide, Weekly Standard and News America New Media), and has held executive positions in Caldor, Inc., a 175-store general merchandise chain, RH Macy’s and the New York Daily News. He has also served on the Boards of Directors of Herald Media, Inc., the American Jewish Committee, the Children’s Miracle Network and the Guardian Angels. Mr. Carlucci holds a Bachelor of Science degree in Marketing from Fordham University. Mr. Carlucci’s pertinent experience, qualifications, attributes and skills include managerial experience and the knowledge and experience he has attained through his service as an executive officer of large media corporations and his expertise in marketing and communications involving various industries, including the U.S. tobacco industry and the New York metropolitan area real estate market.
Jeffrey S. Podell has been a director of the Company since November 1993 and is a private investor. Mr. Podell also serves as a director of Ladenburg Thalmann Financial Services Inc. (NYSE MKT:American: LTS). Mr. Podell was a member of the New York State Bar Association from 1965 until March 2010. Mr. Podell’s pertinent experience, qualifications, attributes and skills include managerial experience and the knowledge and experience he has attained through his service as a director of the Company and other publicly-traded corporations.
Jean E. Sharpe has been a director of the Company since May 1998. Ms. Sharpe is a private investor and has engaged in various philanthropic activities since her retirement in September 1993 as Executive Vice President and Secretary of the Company and as an officer of various of its subsidiaries. Ms. Sharpe previously served as a director of the Company from July 1990 until September 1993. Ms. Sharpe has been a member of the New York State Bar Association since 1979. Ms. Sharpe’s pertinent experience, qualifications, attributes and skills include the knowledge and managerial experience she has attained as serving as our general counsel from 1988 until 1993 and her service as a director of the Company.
Barry Watkins has been a director of the Company since March 2018 and is currently Of Counsel to DKC, a full-service public relations, marketing and government affairs firm. He also serves as a senior advisor to the Madison Square Garden Company (NYSE: MSG). From 1997 to November 2017, Mr. Watkins was head of communications for Madison Square Garden L.P., Madison Square Garden Company and MSG Networks Inc. (NYSE: MSGN) and served as Executive Vice President and Chief Communications Officer from 2010 until November 2017. In his role, Mr. Watkins oversaw MSG's communications and government relations activities, as well as its extensive philanthropic efforts, and, from 2010 to 2014, the human resources department of the MSG companies. Since 2014, Mr. Watkins has also served as Chairman of the Garden of Dreams Foundation, a non-profit organization that works with the MSG companies to positively impact the lives of children facing obstacles. Mr. Watkins is a graduate of St. John’s University. The pertinent experience, qualifications, attributes and skills of Mr. Watkins include his managerial experience as well as the knowledge and experience in communications, government relations and human resources that he attained through his service as an executive officer of publicly-traded corporations.
Board of Directors and Committees
The board of directors, which held eightfive meetings in 20152017, currently has nine members, but had seven members.members during 2017. Each director attended at least 75% of the aggregate number of meetings of the board and of each committee on which the director served as a member during such period. To ensure free and open discussion and communication among the independent directors of the board, the independent directors meet in executive sessions periodically, with no members of management present. The chair of the corporate governance and nominating committee presides at the executive sessions.
The Company’s Corporate Governance Guidelines provide that the board shall be free to choose its chair in any way it deems best for the Company at any time. The board believes that it is desirable to have the flexibility to decide whether the roles of Chairman of the Board and Chief Executive Officer should be combined or separate in light of the Company’s circumstances from time to time. The roles of Chief Executive Officer and Chairman of the Board are presently held by two different directors. The Chief Executive Officer is responsible for setting the strategic direction of the Company and the day-to-day leadership and performance of the Company, while the Chairman of the Board provides guidance to the Chief Executive Officer, reviews the agenda for board meetings and presides over meetings of the full board.
The board of directors oversees the risks that could affect the Company through its committees and reports from officers responsible for particular risks within the Company.
The board of directors has four committees established in accordance with the Company’s bylaws: an executive committee, an audit committee, a compensation committee, and a corporate governance and nominating committee. The board has determined that the Company’s non-employee directors (Stanley S. Arkin, Henry C. Beinstein, Paul V. Carlucci, Bennett S. LeBow, Jeffrey S. Podell, and Jean E. Sharpe)Sharpe and Barry Watkins) have no material relationship with the Company and meet the New York Stock Exchange listing standards for independence. Each of the members of the audit committee, compensation committee, and corporate governance and nominating committee meets the New York Stock Exchange listing standards for independence.
The executive committee, whose members are presently Messrs. LeBow, chairman, and Lorber, did not meet in 20152017. The executive committee exercises, in the intervals between meetings of the board, all the powers of the board in the management and affairs of the Company, except for matters expressly reserved by law for board action.
The audit committee, whose members are presently Messrs. Beinstein, chairman, and Podell and Ms. Sharpe, met 2312 times in 20152017. The committee is governed by a written charter which requires that it discuss policies and guidelines to govern the process by which risk assessment and risk management are handled and that it meet periodically with management to review and assess the Company’s major financial risk exposures and the manner in which such risks are being monitored and controlled. Accordingly, in addition to its other duties, the audit committee periodically reviews the Company’s risk assessment and management, including in the areas of legal compliance, internal auditing and financial controls. In this role, the audit committee considers the nature of the material risks the Company faces, and the adequacy of the Company’s policies and procedures designed to respond to and mitigate these risks and receives reports from management and other advisors. Although the board’s primary risk oversight has been assigned to the audit committee, the full board also receives regular reports from members of senior management on areas of material risk to the Company, including operational, financial, competitive and legal risks. In addition to an ongoing compliance program, the board encourages management to promote a corporate culture that understands risk management and incorporates it into the overall corporate strategy and day-to-day business operations. The Company’s board of directors and its audit committee regularly discuss with management the Company’s major risk exposures, their potential financial impact on the Company, and the steps (both short-term and long-term) the Company takes to manage them. The audit committee oversees the Company’s financial statements, system of internal controls, and auditing, accounting and financial reporting processes and risks related thereto; the audit committee appoints, compensates, evaluates and, where appropriate, replaces the Company’s independent accountants; reviews annually the audit committee charter; and reviews and pre-approves audit and permissible non-audit services. See “Audit Committee Report.” Each of the members of the audit committee is financially literate as required of audit committee members by the New York Stock Exchange and independent as defined by the rules of the New York Stock Exchange and the Securities and Exchange Commission.SEC. The board of directors has determined that Mr. Beinstein is an “audit committee financial expert” as defined by the rules of the Securities and Exchange Commission.SEC.
The compensation committee, whose members are presently Messrs. Podell, chairman, and Arkin, and Ms. Sharpe, met 9four times in 20152017. Mr. Arkin replaced Mr. Beinstein as a member of the Compensation Committee in May 2016. The committee is governed by a written charter. The compensation committee is responsible for risks relating to employment policies and the Company’s compensation and benefits systems. To aid the compensation committee with its responsibilities, the compensation committee retains an independent consultant, as necessary, to understand the implications of compensation decisions being made. See “Compensation Discussion and Analysis” for a discussion of the consulting services provided to the compensation committee by GK Partners. The compensation committee has assessed the independence of GK Partners pursuant to Securities and Exchange CommissionSEC and New York Stock Exchange rules and concluded that GK Partners' work for the compensation committee does not raise any conflict of interest. The compensation committee reviews, approves and administers management compensation and executive compensation plans. The compensation committee also administers the Company’s 1998 Long-Term Incentive Plan, the Amended and Restated 1999 Long-Term Incentive Plan (the “1999 Plan”) and the Senior Executive Incentive Compensation Plan (the “Bonus Plan”) and the 2014 Management Incentive Plan (the “2014 Plan”). See “Compensation Discussion and Analysis.” In March 2009, the compensation committee formed a Performance-Based Compensation Subcommittee (the “Subcommittee”), consisting of Messrs. Arkin and Podell, and delegated to the Subcommittee the authority to grant compensation to executive officers that is intended to qualify as “performance-based compensation” exempt from the $1,000,000 deduction limitation of Section 162(m) of the Internal Revenue Code.Code of 1986, as amended. The Subcommittee administers the participation of named executive officers in the Bonus Plan, the 1999 Plan and the 2014 Plan.
The corporate governance and nominating committee, whose members are presently Ms. Sharpe, chair, and Messrs. Arkin and Beinstein, met twice in 2015.2017. The committee is governed by a written charter. This committee is responsible for the oversight of risks relating to the management and board succession planning. The committee assists the board of directors in identifying individuals qualified to become board members and recommends to the board the nominees for election as directors at the next annual meeting of stockholders, develops and recommends to the board the corporate governance guidelines applicable to the Company, and oversees the evaluation of the board and management. In recommending candidates for the board, the committee takes into consideration applicable to independence criteria and the following criteria established by the board in the Company’s corporate governance guidelines:
personal qualities and characteristics, accomplishments and reputation in the business community;
current knowledge and contacts in the communities in which the Company does business and in the Company’s industry or other industries relevant to the Company’s business;
ability and willingness to commit adequate time to board and committee matters;
the fit of the individual’s skills and personality with those of other directors and potential directors in building a board that is effective, collegial and responsive to the needs of the Company; and
diversity of viewpoints, background, experience and other demographics.
The committee also considers such other factors as it deems appropriate, including judgment, skill, diversity, experience with businesses and other organizations of comparable size, the interplay of the candidate’s experience with the experience of other board members, and the extent to which the candidate would be a desirable addition to the board and any committees of the
board. The committee does not assign specific weights to particular criteria and no particular criteria is necessarily applicable to all nominees. The Company believes that the backgrounds and qualifications of the directors, considered as a group, should provide a significant composite mix of experience, knowledge and abilities that will allow the board to fulfill its responsibilities. In March 2018, the size of the board of directors was increased by two from seven members to nine, and Paul V. Carlucci and Barry Watkins were added as directors on the recommendation of the corporate governance and nominating committee. The new board members were introduced to the committee by the Company's chief executive officer who was familiar with them through their business and philanthropic activities. The committee will consider nominees recommended by stockholders, which nominations should be submitted by directing an appropriate letter and resume to Marc N. Bell, the secretary of the Company, 4400 Biscayne Boulevard, 10th Floor, Miami, Florida 33137. If the Company were to receive recommendations of candidates from the Company’s stockholders, the committee would consider such recommendations in the same manner as all other candidates.
Corporate Governance Materials
The Company’s Corporate Governance Guidelines, Codes of Business Conduct and Ethics, Equity Retention and Hedging Policy, Stock Ownership Guidelines, Executive Compensation Clawback Policy and current copies of the charters of the Company’s audit committee, compensation committee, and corporate governance and nominating committee are all available in the investor relations section of the Company’s website (http://www.vectorgroupltd.com/investor-relations/corporate-governance/) and are also available in print to any stockholder who requests them.
EXECUTIVE COMPENSATION
Compensation Discussion and Analysis
Overview
The Company designed its compensation program for Vector’s executives is designedin 2017 with an intent to maximize stockholder returnreturns and intended to do sodeliver compensation in a tax-efficient manner. Executive compensationmanner for the Company. Compensation for the Company's executives is largely at-risk and contingent upon the Company meeting various performance goals.goals that are consistent with the Company's business plan. The Company's compensation committee recognizes, and its policies reflect, that Vector is a complex and diversified company that operates in two challenging industries - tobacco and real estate. Moreover, both of these industries are impacted by exogenous forces.
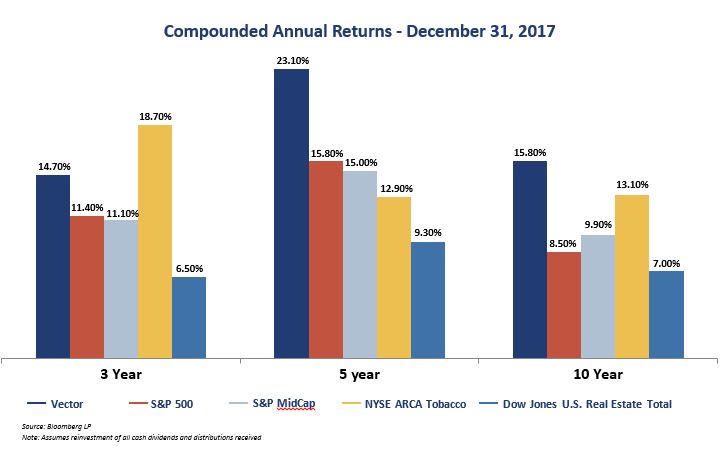
Vector’s Board of Directorsboard has overseen significant value creation for its stockholders. As demonstratedreported below, the Company has consistently outperformed the S&P 500 index and relative peer groups by delivering robust total stockholder returns, and executive compensation is commensurate with Vector’s record of substantial value creation.
Beginning in 2016, Vector meaningfully enhanced its stockholder outreach program to engageexpand the scope of its discussions with institutional investors beyond the traditional emphasis on Vector's Tobacco and Real Estate operations and engaged in productive discussionsdialogue on a variety of corporate and governance-related matters. These initiatives are discussed below in “Most Recent Say On Pay Vote Results.” The Company is committed to sound governance policies and practices, values stockholder input, and takes into consideration the views of its stockholders as it assesses and refines its approach to best incentivizemeans of most effectively incentivizing management to enhance stockholder value.
Compensation Objectives
The compensation committee's primary objectives of thefor our executive compensation committee of the board of directors with respect to executive compensationprogram are:
to base a meaningful portion of management’s pay on achievement of the Company’s goals;annual and long-term goals to ensure alignment of pay and performance;
to provide long and short-term incentives intended to enhance stockholder value;
to provide competitive levels of compensation;
to recognize individual initiative and achievement; and
to assist the Company in attracting talented executives to a challenging and demanding environment, and to retain such executivesthem for the benefit of the Company and its subsidiaries.
The Company strives to achieve these objectives through its compensation plansarrangements that put a substantial portion of the executives’ overall compensation at risk so that compensation is only paid if the Company's financial performance goals are met. While the compensation of the Company’s most senior executives is largely the result of negotiated agreements which(which are reviewed annually,annually), the Company’s overall compensation philosophy is intended to reward its executives with fully competitive compensation, while rewardingproviding opportunities to reward outstanding performance with above-average total compensation.
The Company's compensation committee has recognized that Vector is a complex and diversified company that operates in two challenging industries - tobacco and real estate. The compensation committee has also recognized that the Company's diversification creates difficulties in establishing "peer groups".appropriate “peer groups” permitting meaningful comparison to the Company. Due to the disparities in financial and operational characteristics between the Company and potential comparator companies, the compensation committee has chosen not to formally benchmark compensation levels for management relative to any specified group of comparable companies. The compensation committee has, however, reviewed and considered information provided by its compensation consultant concerning relevant market executive compensation practices and, as such believes that it is appropriately informed with regard to these practices as they pertain to the Company's business. In establishing levels of executive compensation, the compensation committee considers Vector's well-established record of consistently creating value for stockholders by posting highachieving stockholder returns that exceed comparable indices in the tobacco and real estate segments. The compensation committee believes these highabove-market returns have been the result of the Company's strong operating performance in both the tobacco and real estate segments as well as an increaseimprovement in the marketmarket's knowledge and perception of the Company.
The Company has recently taken measuressignificant steps toward risk-mitigation and other long-term objectives to further align management and stockholders. Since 2013, the Company has implemented significant enhancements to discourage excessive risk-taking by adopting aan Executive Compensation Clawback Policy, and prohibition on hedging and has increased the long-term focus by adopting ana robust Equity Retention Policyand Hedging policy that prohibits hedging by executive officers and requires executive officers to retain at least 25% (after taxes and exercise costs) of the shares of common stock acquired under an incentive, equity or option award granted to them after January 1, 2013 and Stock Ownership Guidelines as well as by awardingrequiring each executive officer to hold the Company's common stock. In addition, over the past five years, the Company granted stock options with four-year cliff vesting as a substantial portion of 2013 and 2014 direct compensation.compensation in order to incentivize executives to focus on long-term strategic directives. Under the 2014 Plan, the Company is able to make vesting and payment of certain other equity awards are contingent upon achieving specified levels of long-term corporate performance.
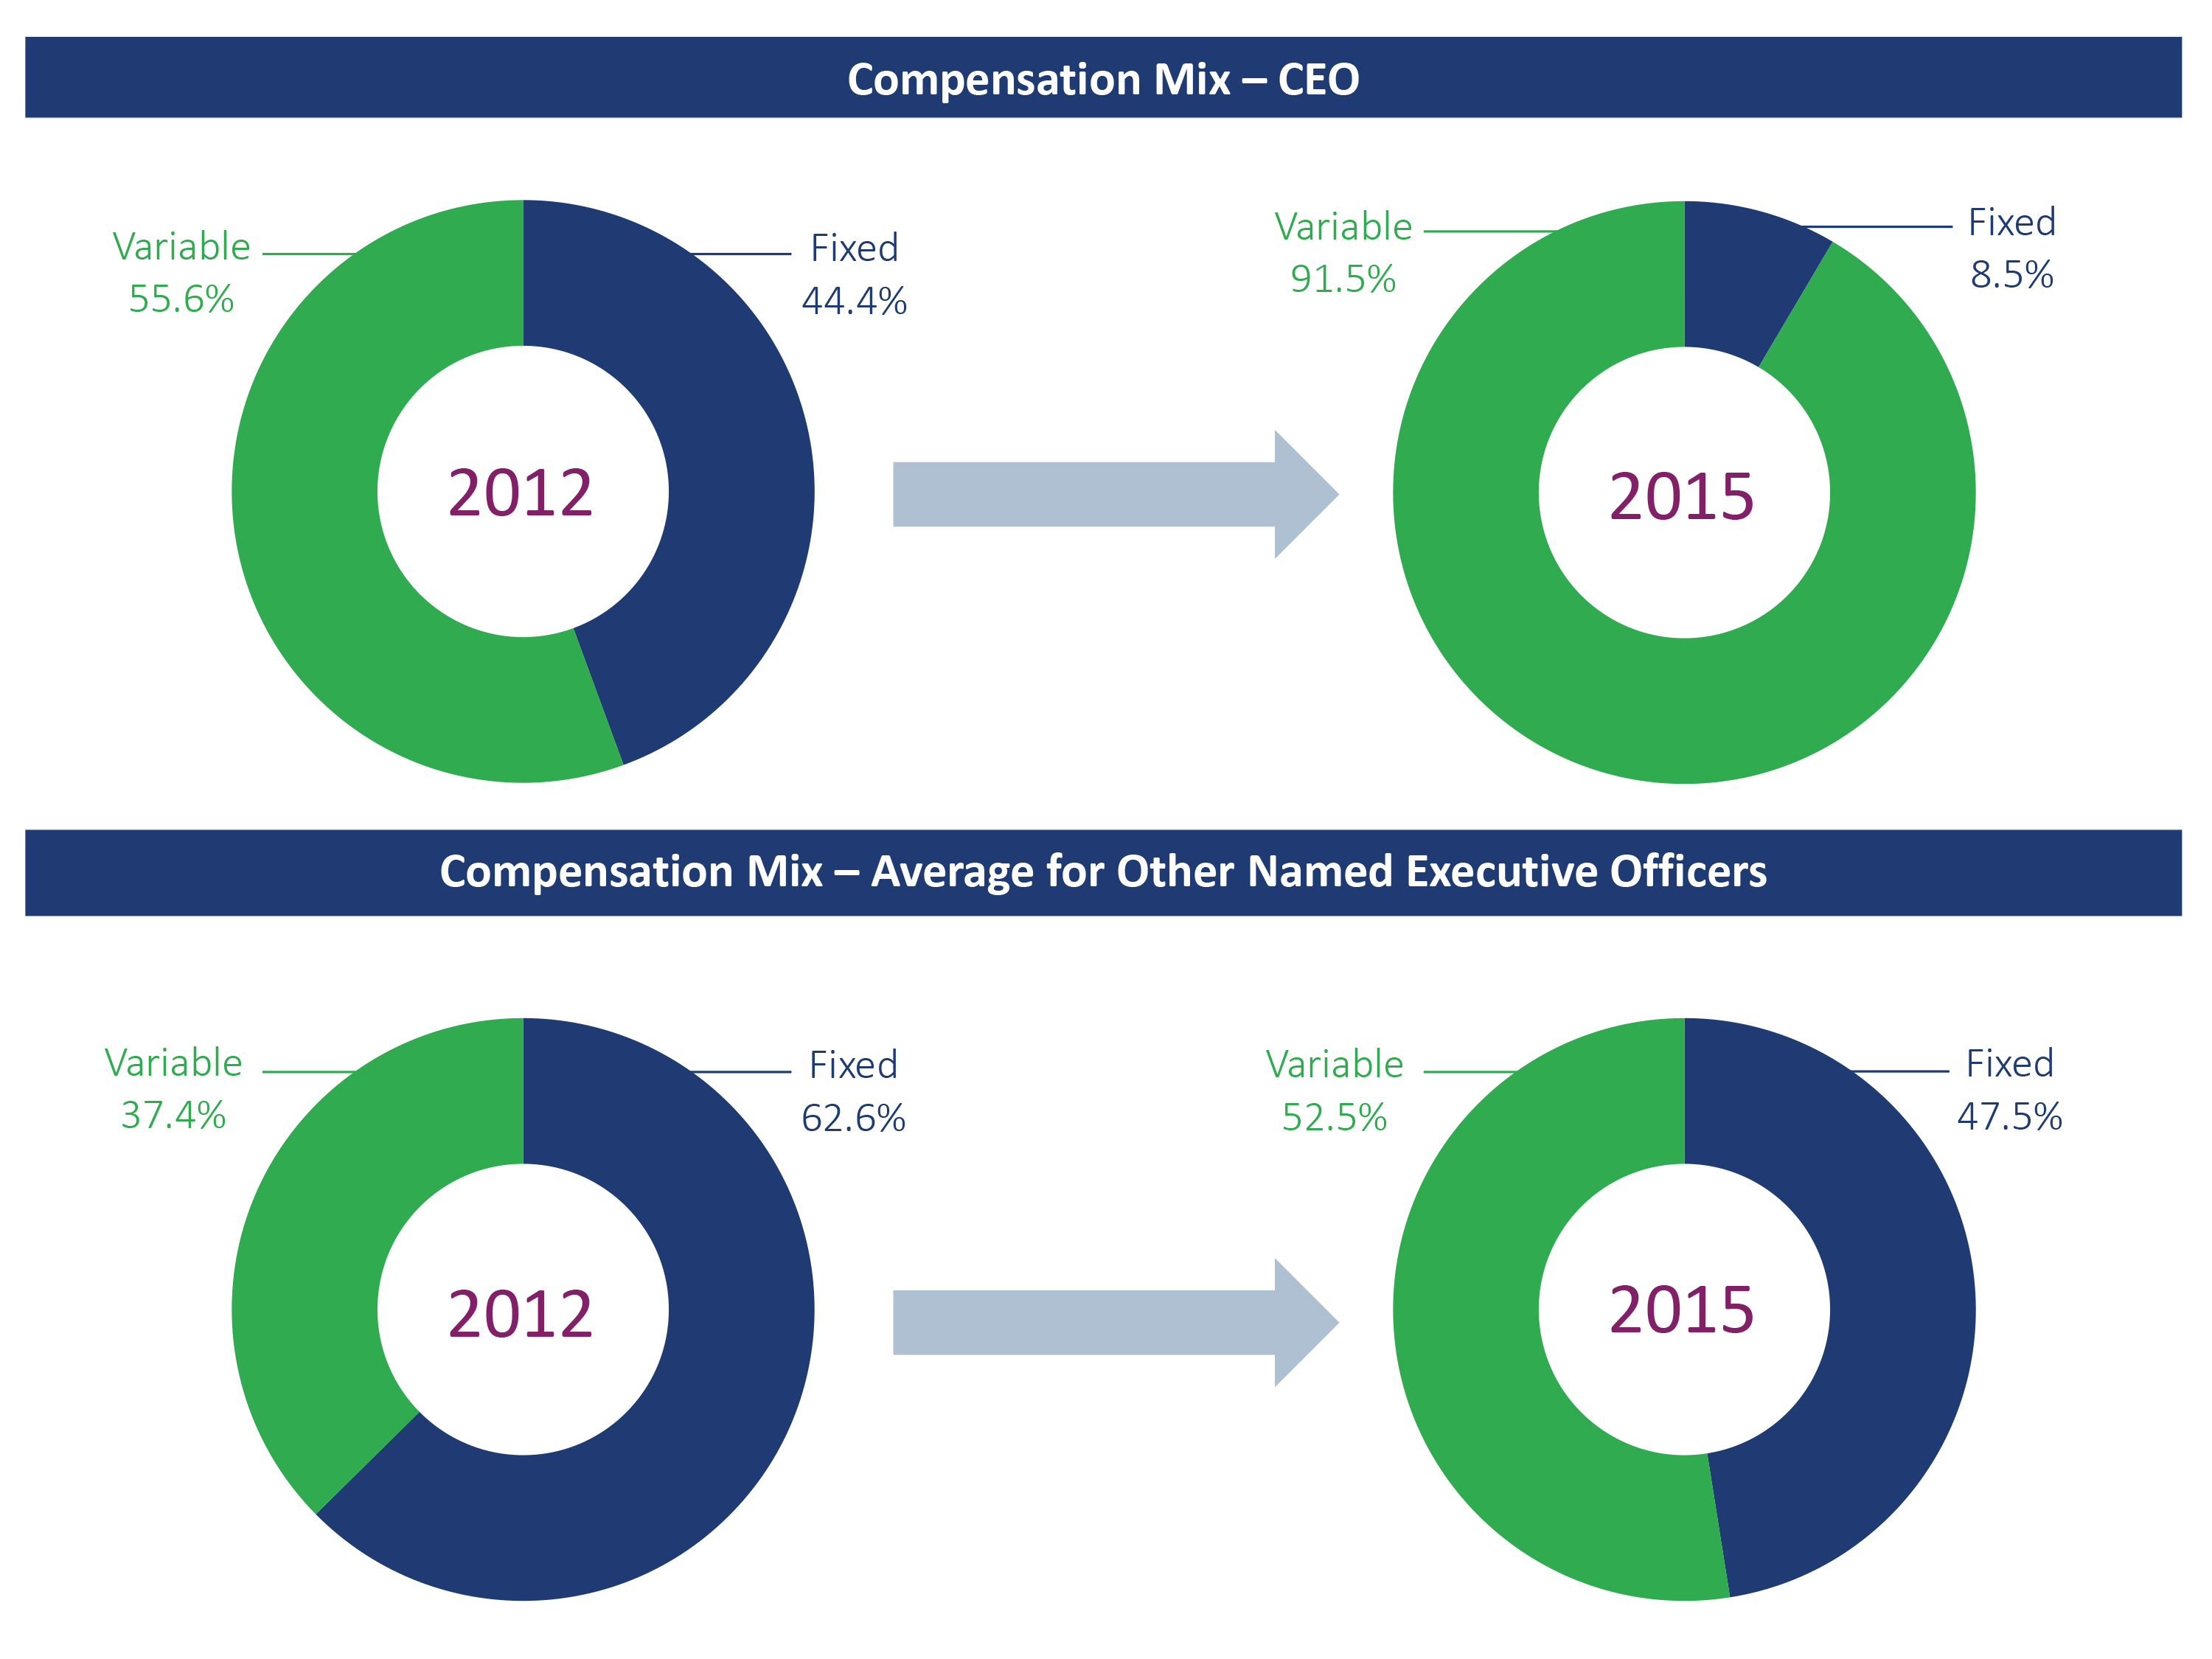
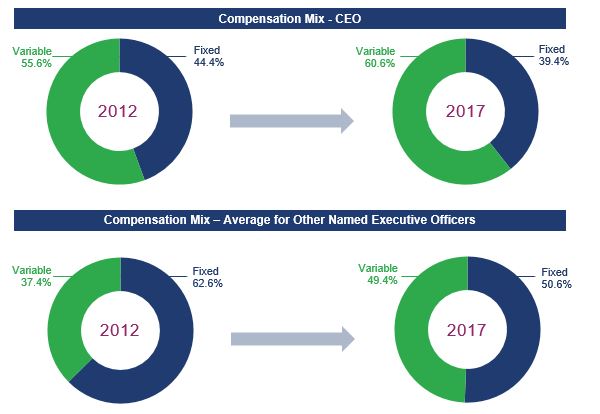
Compensation Mix
Beginning in 2013, Vector’s executive compensation mix has become increasingly performance-based and consequently more clearly aligned with stockholder interests. The following charts illustrate the mix between direct compensation elements (base salary, annual cash and stock bonus, and long-term equity incentives) for Vector's Chief Executive Officer and other named executive officers forand compare the years ended December 31, 2012 and 2015,2017, respectively. These charts demonstrate thathow the Company's performance-based direct compensation has increased as a percentage of total direct compensation for these officers since the year ended December 31, 2012.
Most Recent Say on Pay Vote Results
At the 20152017 annual meeting of stockholders, the Company held its fifth stockholder advisory (sayseventh say on pay)pay vote on the compensation of its named executive officers and 57%approximately 60% of the Company's stockholders voted “for” the compensation of the Company's named executive officers. The Company and itsCompany's compensation committee thoughtfully considered the result of the 20152017 vote in conducting the ongoing review and administration of management compensation. The compensation committee has noted that because Vector is a uniquediversified company, and it is difficult to reference a "peer group"; however,single “peer group.” Moreover, as reflected in the charts above,on page 10, the Company has consistently outperformed indices of both segments in which it operates - real estate and tobacco companies and, as a result,companies. Consequently, the compensation committee continues to believe that its compensation model is appropriate. appropriate and effective.
Meetings with Institutional Stockholders
In 2013 and 2014,response to the 2016 say on pay vote, the Company undertook severalenhanced efforts to solicit feedback from its stockholders to better understand their concerns by inviting representatives from the corporate governance initiatives summarized above. In 2015, senior membersdivisions of its 25 largest institutional stockholders to meet with a member of the Company's managementboard and management. Seven of the 25 institutional stockholders, who collectively hold approximately 17% of Vector’s common shares, accepted the invitation to speak with representatives of the Company in 2016. These meetings with the corporate governance divisions of the institutional stockholders were led by Jean E. Sharpe, board member and corporate governance and nominating committee chair, and J. Bryant Kirkland III, Chief Financial Officer. Ms. Sharpe, Mr. Kirkland and Henry C. Beinstein, audit committee chair, also metheld a meeting with current, formera proxy advisory firm to determine whether its views regarding Vector’s pay practices were similar to the views of the Company’s stockholders.
During these meetings, Ms. Sharpe and prospective stockholders, many of whom have commended the Company's leadership team, to enhance its understanding of stockholder perspectives related to executive compensation. ManagementMr. Kirkland explained the Company's core compensation practices and sought candid stockholder feedback during these meetings related to key elements of the Company's compensation program. In response, representatives from the corporate governance divisions of all participating institutions were complimentary of the Company's enhanced scope of communication with the governance divisions of its institutional investors and the Company hopes they began to appreciate more fully the challenges faced by the Company in establishing compensation levels under its bifurcated business model. The corporate governance representatives also acknowledged they understood that the Company’s diversification creates difficulties in establishing executive compensation “peer groups,” making it difficult to establish an appropriate barometer to measure the Company's compensation package. The investors also stated they recognized the Company's existing contracts with named executive officers may not be easily modified and most were willing to consider the elements of compensation that resulted from legacy contracts. Many of the institutions also commended the Company and its leadership team for the outstanding long-term performance of the Company's common stock.
Related to specific pay practices, all seven institutional investors who participated in the calls expressed concerns about the Chief Executive Officer’s compensation. Issues raised included (i) large restricted stock awards to the CEO in consecutive years (2014 and 2015), (ii) the ratio of CEO pay to the pay of other named executive officers, (iii) the “catch-up” provision of Adjusted EBITDA contained in the 2014 and 2015 performance-based restricted stock awards and (iv) a lack of detailed disclosure explaining how the Company ties compensation to its long-term strategy. The institutional investors suggested that the Company's Compensation Disclosure and Analysis in its Proxy Statement should be more robust in tying executive compensation to the Company's long-term strategy. They also requested additional disclosure of the factors, including marketplace data, that the Company considers in designing its compensation programs and making decisions.
The Company had telephonic meetings with six institutional investors during the period it was soliciting proxies for the Company's 2017 Annual Meeting. Afterwards, while the Company did not seek additional meetings with the corporate governance divisions of its institutional investors, it continued to engage with stockholders who wished to have discussions. The Company had two additional calls with institutional investors in 2017 and many of the same themes from the earlier meetings were reiterated.
As of the date hereof, the Compensation Committee, with assistance from its compensation consultant, GK Partners, Inc., continues to thoughtfully consider the feedback received from its institutional investors. While specific changes to the Company's executive compensation program have not yet been implemented since many of the observations of the institutional investors pertain to past compensation decisions, the Compensation Committee expects to consider these concerns in the design of the Company's compensation program for 2018 and thereafter.
See the discussion of this year's say on pay vote at “Board Proposal 2 - Advisory Vote on Executive Compensation” for further discussion.
Compensation Components
The key components of the Company’s executive compensation program consist of a base salary, an annual performance-based bonus pursuant to the 2014 Plan, equity awards under the 1999 Plan and the 2014 Plan and various benefits, including the Company’s Supplemental Retirement Plan, the Liggett Vector Brands Inc. Savings Plan (the “401(k) Plan ”) and the use of corporate aircraft by the President and Chief Executive Officer. The employment agreements with the Company’s named executive officers also provide for severance compensation in the event of termination other than for cause during the term of the agreement or, in certain cases, following a change in control of the Company during the term of the agreements.
Base Salary
Base salaries for the Company’s named executive officers are established based on their overall business experience and managerial competence in their respective executive roles, as well as their personal contributions to the Company and are intended to provide a competitive levellevels of fixed compensation. The compensation committee believes that executive base salaries should be targeted at competitive levels while rewarding long-term outstanding performance with above-average total compensation. Base salaries are reviewed annually, based on recommendations by the Company’s Chief Executive Officer with respect to the salaries of executive officers other than himself, and may be increased from time to time based on review of Companythe Company's results and individual executive performance. An automatic cost of living adjustment to base salary is included under the terms of Mr. Lorber's employment agreement. Effective January 1, 2016,2018, as a result of thehis cost of living provision, Mr. Lorber's base salary was increased to $3,132,401 and, as a result of a merit increase, Mr. Kirkland's base salary was increased from $425,000 to $500,000.$3,248,391. The compensation committee did not adjust the salaries of the other named executive officers in 2015 as part of the annual compensation review process.2017.
Annual Incentive Bonus Awards
The Company's executive officers are eligible to participate inearn annual cash incentive bonus awards on an annual basis under the 2014 Plan. The compensation committee has delegated to theits Performance-based Compensation Subcommittee, consisting of Messrs. Arkin and Podell, the authority to grant compensation to executive officers under the 2014 Plan that is intended to qualify as “performance-based
compensation” exempt from the $1,000,000 deduction limitation ofunder Section 162(m) of the Internal Revenue Code. Thus, with respect to these officers, the Subcommittee selects participants in the 2014 Plan, determines the amount of their award opportunities, selects the performance criteria and the performance goals for each year, determines whether the performance goals have been met and administers and interprets the 2014 Plan. An eligible executive may (but need not) be selected to participate in annual incentive bonus awards under the 2014 Plan.
In 20152017, each of the Company's named executive officers participated in the annual cash incentive bonus program under the 2014 Plan. The annual incentive bonus performance criteria for 20152017 varied among the participants depending upon the entity that employed the participant.participant after considering the differing regulatory and competitive landscapes. For Messrs. Lorber, Lampen, Kirkland and Bell, as in previous years, the criteria for 20152017 were based on: 37.5% onfor adjusted earnings before interest and taxes, or Adjusted EBIT, as defined in the 2014 Plan, of Liggett; 37.5% onfor distributions to stockholders of the Company; and 25% onfor adjusted earnings before interest, taxes and amortization, or Adjusted EBITA, as defined in the 2014 Plan, of Douglas Elliman Realty, LLC.LLC (“Douglas Elliman”). For Mr. Bernstein, 50% is based on Liggett Adjusted EBIT, as defined, and 50% is based on Liggett Volume. These measures were chosen because Adjusted EBIT is commonly used as ato measure of performance in the tobacco industry and Adjusted EBITA is commonly used to measure performance in the real estate brokerage industry and are, inindustry. In each case, these criteria are the principal drivers of the business performance and stockholder value in those industries.
Under the terms of their respective employment agreements, for 20152017, Messrs. Lorber, Lampen, Kirkland, Bell and Bernstein were eligible to receive a target bonusincentive opportunity of 100%, 50%, 25%33.33%, 25% and 100% of their respective base salaries.
Depending on the level of achievement of the performance criteria, the actual amounts of incentive bonusespayments could also exceed the target bonusannual incentive amounts for Messrs. Lorber, Lampen, Kirkland and Bell (see “Grants of Plan-Based Awards in 20152017”). The Subcommittee may exercise negative discretion with respect to any award to reduce any amount that would otherwise be payable under the annual incentive bonusesprogram granted under the 2014 Plan.
The 20152017 performance necessary for Messrs. Lorber, Lampen, Kirkland, Bell and Bernstein to receive bonusesannual incentive awards at the target level were set at levels which were believed to be rigorous, but reasonably achievable, based on internal corporate plans.
For Messrs. Lorber, Lampen, Kirkland and Bell, the performance necessary to achieve the minimum, target or maximum bonusawards in 20152017 was as follows:
percentages of the target bonuscash incentive opportunity based on Liggett Adjusted EBIT were $185,000,000$236,250,000 (50%), $215,000,000$256,250,000 (100%), and $220,000,000$261,250,000 and above (125%); the actual Liggett Adjusted EBIT for 20152017 were $237,542,000265,948,000;
percentages of the target bonuscash incentive opportunity based on cash dividends per share of the Company were $1.40 (50%), $1.60 (100%), and $1.80 and above (125%); the actual cash dividends paid in 20152017 were $1.60 per share; and,
percentages of the target bonuscash incentive opportunity based on Douglas Elliman Adjusted EBITA were $45,000,000$30,000,000 (50%), $52,500,000$40,000,000 (100%), and $60,000,000$45,000,000 and above (125%); the actual Douglas Elliman Adjusted EBITA for 20152017 were $55,695,000.$41,824,000.
Based on actual 20152017 results compared to the established performance criteria, bonusesannual cash incentive payments equal to 112.0375%111.655% of target bonus amounts were achieved and awarded to Messrs. Lorber, Lampen, Kirkland and Bell, and they were awarded bonuses of 112.0375% of their respective target bonus amounts.Bell.
For Mr. Bernstein, the performance necessary to achieve the minimum target or maximum bonusincentive award in 20152017 werewas as follows:
percentages of target bonuscash incentive opportunity based on Liggett Adjusted EBIT were $215,000,000$256,250,000 (50%) and $220,000,000$261,250,000 and above (100%); the actual Liggett Adjusted EBIT for 20152017 were $237,542,000265,948,000; and,
percentages of target bonus basedcash incentive opportunity on Liggett Volume of 8.07.5 billion units (50%) and 8.58.0 billion units (100%); the actual Liggett Volume for 20152017 was 8.99.15 billion units.
Based on actual 20152017 results compared to the established performance criteria, 100% of Mr. Bernstein’s target bonusincentive opportunity was achieved and awarded to him.
Bonus amounts for achieving performance criteria in between the amounts listed above are determined by linear interpolation between the higher and lower amounts. The actual performance-based bonusincentive payments made to the selected participants for the years ended December 31, 20132015, 20142016 and 20152017 are set forth in the column labeled “Non-Equity Incentive Plan Compensation” in the Summary Compensation Table. Performance bonus awardsAnnual incentive compensation earned by named executive officers after February 26, 2014 areis subject to the Company's Executive Compensation Clawback Policy.
Equity Compensation
Long-term equity compensation is intended to provide a variable pay opportunity that rewards long-term performance by the Company as a whole and serves as a significant incentive to remain with the Company. In establishing long-term equity compensation awards, the compensation committee has considered the above-market returns generated by the Company.
On February 29, 2016, the Subcommittee granted options to Messrs. Lorber (250,000 shares), Lampen (62,500 shares), Kirkland (37,500 shares) and Bell (37,500 shares) to recognize past and current performance and to serve as a means of incentivizing and retaining key employees. The options are non-qualified options with a ten-year term with cliff vesting on the fourth anniversary of grant and have an exercise price equal to the market price on the date of grant ($23.23). The options have dividend equivalent rights. Shares received upon exercise of the February 29, 2016 option grants will be subject to the Company's Equity Retention and Hedging Policy. See “Equity Retention Policy.”
Dividend Equivalents
Under the terms of various equity awards made to the Company’s named executive officers under the Company’s stock plans, dividend equivalent payments and distributions are made to the executive officers with respect to the shares of Common Stock underlying the unexercised and unvested portion of the equity awards and the termsexercise prices of equity awardsstock options are adjusted to reflect stock dividends. These payments and distributions are made at the same rate as dividends and other distributions paid on shares of the Company’s Common Stock. In 2015,2017, named executive officers earned cash dividend equivalent payments on unexercised stock options (in the case of Messrs. Lorber, Lampen, Kirkland and Bell) and unvested restricted stock (in the case of Mr. Bernstein) as follows: Mr. Lorber — $4,164,9825,422,138; Mr. Lampen —$761,6301,047,254; Mr. Kirkland — $423,895591,878; Mr. Bell — $379,245542,650; and Mr.
Bernstein - $46,778.— $51,569. In accordance with the disclosure rules of the SEC, these amounts have not been separately reported in the Summary Compensation Table because the value of the dividend equivalent rights was included in the initial grant date fair value of the underlying optionsoption grants which is reported in the table.
Supplemental Retirement Plan
Retirement benefits are designed to reward long and continuous service by providing post-employment security and are an essential component of a competitive compensation package.
The Company’s named executive officers and certain other management employees are eligible to participate in the Supplemental Retirement Plan, which was adopted by the board of directors in January 2002 to promote retention of key executives and to provide them with financial security following retirement. As described more fully and quantified in “Pension Benefits at 20152017 Fiscal Year End,” the Supplemental Retirement Plan provides for the payment to a participant at his or her normal retirement date of a lump sum amount that is the actuarial equivalent of a single life annuity commencing on that date. The single life annuity amounts for the named executives were determined by the Company’s board of directors giving consideration to a variety of pertinent factors including (but not limited to) the executive’s level of annual compensation.
Other Benefits
The Company’s executive officers are eligible to participate in all of its employee benefit plans, such as medical, dental, vision, group life, disability and accidental death and dismemberment insurance and Liggett Vector Brandsthe 401(k) plan.Plan. These benefits are designed to provide a safety net of protection against the financial catastrophes that can result from illness, disability or death. The Company also provides vacation and other paid holidays to its executive officers, as well as certain other perquisites further described below and in the Summary Compensation Table.
Perquisites
The Company provides the perquisites or personal benefits to its named executive officers discussed below. The Company’s corporate aircraft are made available for the personal use of Mr. Lorber and other executive officers at Mr. Lorber’s discretion. The Company’s corporate aircraft policy permits personal use of corporate aircraft by executives, subject to an annual limit of $200,000 for personal use by Mr. Lorber. For purposes of determining the amounts allowable under thethis policy, the value of the personal usage is calculated using the applicable standard industry fare level formula established by the Internal Revenue Service (as distinguished from the aggregate incremental cost approach used for determining the value included in the Summary Compensation Table), and Mr. Lorber and any other executive officers pay income tax on such value. In addition, Mr. Lorber is entitled to a car and driver provided by the Company, a $7,500 per month allowance for lodging and related business expenses, and two club memberships. See the Summary Compensation Table for details regarding the value of perquisites received by the named executive officers.
Change in Control Provisions
The employment agreement entered into between the Company and Mr. Lorber contains change in control provisions. In the event of a change in control that results in a termination of employment without cause (a “double trigger” change in control provision), Mr. Lorber will receive severance benefits. The purpose of these provisions is to avoid the distraction and loss of key management personnel that may occur in connection with rumored or actual corporate transactions and/or other fundamental
corporate changes and to provide adequate protection to key management personnel in the event that their employment is terminated following a change of control. A change in control provision protects stockholder interests by enhancing employee focus during rumored or actual change in control activity through incentives to remain with the Company despite uncertainties while a transaction is under consideration or pending and by assurance of the payment of severance and benefits for terminated executives. A detailed summary of these provisions is set forth under the heading “Payments Made Upon a Change in Control.”
Inter-Relationship of Elements of Compensation Packages
The various elements of the compensation packages for the Company’s executive officers are not directly inter-related. For example, if it does not appear as though the target bonusannual cash incentive award will be achieved, the number of options that will be granted is not affected. If options that are granted in one year become underwater due to a decreasedecline in the Company’s stock price, the amount of the bonus amountannual cash incentive award or compensation to be paid the executive officer for the next year is not impacted. Similarly, if options become extremely valuable due to a rising stock price, the amount of compensation or bonusannual cash incentive award to be awarded for the next year is not affected. However, the compensation committee does evaluate the total value of executive remuneration when making decisions with respect to any particular element thereof.compensation element.
Prohibition on Hedging
Under the Company's Equity Retention and Hedging Policy, adopted in January 2013, ourthe Company's executive officers are prohibited from hedging ownership of shares of Common Stock acquired under an incentive equity or option award granted after January 1, 2013, (the “Equity Award Shares”), including by trading in publicly traded options, puts, calls or other derivative instruments related to the Company's Common Stock.
Equity Retention Policy
Under its Equity Retention and Hedging Policy, the Company formalized its long-standing practice of significant share retention by senior management. Until normal retirement age as defined in the the Company's Supplemental Executive Retirement Plan, each executive officer is required to retain at least 25% (after taxes and exercise costs) of Equity Award Shares.
Stock Ownership Guidelines
In March 2014, the Company formalized its long-standing practice of significant share ownership by senior management by adopting Stock Ownership Guidelines. These guidelines are applicable to all named executive officers and each non-employee member of the Board. Under the guidelines, which are phased in within the later of five years after the adoption of the guidelines or the date that a covered person becomes a named executive officer ofor member of the Board, the following ownership requirements exist.
| Title | Value of Shares Owned | |||
| Chief Executive Officer | 3.0 | X | Base Salary | |
| Executive Vice Presidents | 1.5 | X | Base Salary | |
| Other named executive officers | 1.0 | X | Base Salary | |
| Non-employee directors | 2.0 | X | Annual Retainer | |
“Shares owned” for purposes of the policy include shares of the Company's stock owned outright, any shares held under an employee benefit plan, and restricted shares. The valuation of shares includes all shares held beneficially or directly by any covered person or the person's family members or trusts but excludes pledged shares. Compliance is tested on the last day of each quarter. As of December 31, 2017, all covered employees were in compliance with the guidelines.
Executive Compensation Clawback Policy
In March 2014, the Company adopted an Executive Compensation Clawback Policy (the “Clawback Policy”), which states as a condition to receiving areceive bonus andor incentive-based compensation from the Company, each named executive officer shallmust enter into an agreement with the Company providing that any performance-based compensation awarded, paid or payable by the Company or any of its subsidiaries subsequent to the date of adoption of the Clawback Policy shall be subject to recovery or “clawback” by the Company. Under the Clawback Policy, if the Company’s financial results are restated, the result of which is that any performance-based compensation would have been lower had it been calculated based on such restated results, the compensation committee shall review the performance-based compensation received by the named executive officers. If the compensation committee determines that the performance-based compensation would have been lower and that a named executive officer who received such compensation engaged in fraud, material financial or ethical misconduct or recklessness in the performance of the named executive officer's duties or intentional illegal conduct which materially contributed to the restatement, then the compensation committee may seek to recover the after-tax portion of the excess amount of performance-based compensation. Under the policy, the compensation committee has the discretion to determine to seek recovery of the performance-based compensation after notice and an opportunity to be heard is provided to the named executive officer.
Tax and Accounting Implications
Deductibility of Executive Compensation
The compensation committee and its Subcommittee review and consider the deductibility of executive compensation under Section 162(m) of the Internal Revenue Code of 1986, as amended (the “Code”), which generally providesimposes a $1,000,000 limit on the amount that no publicly-helda publicly-traded company may deduct on compensation in excess of $1,000,000 paid in any taxable year to its chief executive officer and chief financial officer or any of its three other highest compensated officers (other thanofficers. Prior to the Chief Financial Officer) at year-end unlessTax Cuts and Jobs Act of 2017, Section 162(m) included an exception to the compensation qualifies as “performance-based.”limit for “qualifying performance-based compensation”; however, the Tax Cuts and Jobs Act of 2017 eliminated this exception.
Determinations with respect to compensation intended to be deductible under Section 162(m) of the Code are made by the Subcommittee, which consists of Messrs. Podell and Arkin, who qualify as “outside directors” under Section 162(m). In certain situations, the compensation committee or the Subcommittee has in the past and may in the future approve compensation that will not meet these deductibility requirements in order to ensure appropriate and competitive levels of total compensation for the Company’s executive
officers. In this regard, compensation paid to Messrs. Lorber and Lampennamed executive officers in excess of $1,000,000 from base salary and dividend equivalent rights in 20152017 was not deductible for federal income tax purposes under Section 162(m) of the Code.
Accounting for Stock-Based Compensation
The Company accounts for stock-based compensation, including stock option and restricted stock awards under the Plans, in accordance with the requirements of Financial Accounting Standards Board Accounting Standards Codification Topic 718 (“FASB ASC Topic 718”).
Compensation Committee Report
The compensation committee has reviewed and discussed the Compensation Discussion and Analysis set forth above with management and, based on such review and discussion, has recommended to the board of directors that the Compensation Discussion and Analysis be included in this proxy statement.
| THE COMPENSATION COMMITTEE | |
| Jeffrey S. Podell, Chairman | |
| Stanley S. Arkin | |
| Jean E. Sharpe | |
SUMMARY COMPENSATION TABLE FOR YEARS 20132015 — 20152017
The following table summarizes the compensation of the named executive officers for the years ended December 31, 20152017, 20142016 and 20132015. The named executive officers are the Company’s Chief Executive Officer, Chief Financial Officer, and the three other most highly compensated executive officers ranked by their total compensation in the table below (not taking into account the amount in the Change in Pension Value and Nonqualified Deferred Compensation Earnings column).
| Salary | Bonus | Stock Awards | Option Awards | Non-Equity Incentive Plan Compensation | Change in Pension Value and Nonqualified Deferred Compensation Earnings | All Other Compensation | Total | Salary | Bonus | Stock Awards | Option Awards | Non-Equity Incentive Plan Compensation | Change in Pension Value and Nonqualified Deferred Compensation Earnings | All Other Compensation | Total | |||||||||||||||||||||||||||||||||||||||||
| Name and Principal Position | Year | ($)(1) | ($) (2) | ($) (3) | ($) (3) | ($)(4) | ($)(5) | ($) | ($) | Year | ($)(1) | ($) (2) | ($) (3) | ($) (3) | ($)(4) | ($)(5) | ($) | ($) | ||||||||||||||||||||||||||||||||||||||
| Howard M. Lorber | 2015 | $ | 3,110,009 | — | $ | 28,374,000 | $ | 1,617,199 | $ | 3,484,376 | $ | 5,562,312 | $ | 393,834 | (6) | $ | 42,541,730 | 2017 | $ | 3,198,494 | — | — | $ | 1,348,296 | $ | 3,571,278 | $ | 2,044,565 | $ | 471,299 | (6) | $ | 10,633,932 | |||||||||||||||||||||||
| President and Chief | 2014 | $ | 3,100,398 | — | $ | 20,780,000 | $ | 819,154 | $ | 3,584,835 | $ | 988,540 | $ | 363,712 | $ | 29,636,639 | 2016 | $ | 3,132,401 | — | — | $ | 1,272,384 | $ | 3,457,562 | $ | 2,826,334 | $ | 370,426 | $ | 11,059,107 | |||||||||||||||||||||||||
| Executive Officer | 2013 | $ | 3,055,482 | — | — | $ | 1,358,307 | $ | 3,532,901 | $ | 1,142,443 | $ | 355,675 | $ | 9,444,808 | 2015 | $ | 3,110,009 | — | $ | 28,374,000 | $ | 1,617,199 | $ | 3,484,376 | $ | 5,562,312 | $ | 393,834 | $ | 42,541,730 | |||||||||||||||||||||||||
| Richard J. Lampen | 2015 | $ | 900,000 | — | — | $ | 404,300 | $ | 504,169 | $ | 508,515 | $ | 7,950 | (7) | $ | 2,324,934 | 2017 | $ | 900,000 | — | — | $ | 337,074 | $ | 502,448 | $ | 241,836 | $ | 8,100 | (7) | $ | 1,989,458 | ||||||||||||||||||||||||
| Executive Vice | 2014 | $ | 900,000 | — | — | $ | 357,950 | $ | 520,313 | $ | 130,243 | $ | 7,800 | $ | 1,916,306 | 2016 | $ | 900,000 | — | — | $ | 318,096 | $ | 496,713 | $ | 334,305 | $ | 7,950 | $ | 2,057,064 | ||||||||||||||||||||||||||
| President | 2013 | $ | 900,000 | $ | — | — | $ | 597,821 | $ | 520,313 | $ | 323,844 | $ | 7,650 | $ | 2,349,628 | 2015 | $ | 900,000 | — | — | $ | 404,300 | $ | 504,169 | $ | 508,515 | $ | 7,950 | $ | 2,324,934 | |||||||||||||||||||||||||
| J. Bryant Kirkland III | 2015 | $ | 425,000 | $ | 39,664 | — | $ | 302,664 | $ | 119,040 | $ | 13,757 | $ | 7,950 | (7) | $ | 908,075 | 2017 | $ | 500,000 | — | — | $ | 306,343 | $ | 186,073 | $ | 187,347 | $ | 8,100 | (7) | $ | 1,187,863 | |||||||||||||||||||||||
| Vice President, Chief | 2014 | $ | 425,000 | — | — | $ | 274,611 | $ | 122,852 | $ | 110,975 | $ | 7,800 | $ | 941,238 | |||||||||||||||||||||||||||||||||||||||||
| Financial Officer and Treasurer | 2013 | $ | 425,000 | — | — | $ | 434,956 | $ | 122,852 | $ | 86,931 | $ | 7,650 | $ | 1,077,389 | |||||||||||||||||||||||||||||||||||||||||
| Senior Vice President, | 2016 | $ | 500,000 | — | — | $ | 258,186 | $ | 183,949 | $ | 145,729 | $ | 7,950 | $ | 1,095,814 | |||||||||||||||||||||||||||||||||||||||||
| Chief Financial Officer and Treasurer | 2015 | $ | 425,000 | $ | 39,664 | — | $ | 302,664 | $ | 119,040 | $ | 13,757 | $ | 7,950 | $ | 908,075 | ||||||||||||||||||||||||||||||||||||||||
| Marc N. Bell | 2015 | $ | 425,000 | $ | 250,000 | — | $ | 302,664 | $ | 119,040 | $ | 318,021 | $ | 7,950 | (7) | $ | 1,422,675 | 2017 | $ | 425,000 | — | — | $ | 306,343 | $ | 118,633 | $ | 343,770 | $ | 8,100 | (7) | $ | 1,201,846 | |||||||||||||||||||||||
| Vice President, | 2014 | $ | 425,000 | — | — | $ | 274,611 | $ | 122,852 | $ | 150,317 | $ | 7,800 | $ | 980,580 | |||||||||||||||||||||||||||||||||||||||||
| Senior Vice President, | 2016 | $ | 425,000 | $ | 250,000 | — | $ | 258,186 | $ | 117,279 | $ | 267,403 | $ | 7,950 | $ | 1,325,818 | ||||||||||||||||||||||||||||||||||||||||
| General Counsel and Secretary | 2013 | $ | 425,000 | — | — | $ | 289,970 | $ | 122,852 | $ | 126,694 | $ | 7,650 | $ | 972,166 | 2015 | $ | 425,000 | $ | 250,000 | — | $ | 302,664 | $ | 119,040 | $ | 318,021 | $ | 7,950 | $ | 1,422,675 | |||||||||||||||||||||||||
| Ronald J. Bernstein | 2015 | $ | 1,000,000 | — | — | — | $ | 1,000,000 | $ | 202,652 | $ | 7,950 | (7) | $ | 2,210,602 | 2017 | $ | 1,000,000 | — | — | — | $ | 1,000,000 | $ | 280,744 | $ | 8,100 | (7) | $ | 2,288,844 | ||||||||||||||||||||||||||
| President and Chief | 2014 | $ | 1,000,000 | — | — | — | $ | 500,000 | $ | 234,733 | $ | 7,800 | $ | 1,742,533 | 2016 | $ | 1,000,000 | — | — | — | $ | 1,000,000 | $ | 261,187 | $ | 7,950 | $ | 2,269,137 | ||||||||||||||||||||||||||||
| Executive Officer of Liggett Vector Brands and Liggett | 2013 | $ | 908,719 | — | $ | 458,425 | — | $ | 855,514 | $ | 482,574 | $ | 7,650 | $ | 2,712,882 | 2015 | $ | 1,000,000 | — | — | — | $ | 1,000,000 | $ | 202,652 | $ | 7,950 | $ | 2,210,602 | |||||||||||||||||||||||||||
___________________________
| (1) | Reflects actual base salary amounts paid for |
| (2) | Mr. Kirkland's bonus for 2015 related to his management of the Company's financial matters and Mr. Bell’s |
| (3) | Represents the aggregate grant date fair value of stock or stock options granted under the 2014 Plan, |
| (4) | These amounts reflect performance-based cash awards under the 2014 Plan |
| (5) | Amounts reported represent the increase in the actuarial present value of benefits associated with the Company’s pension plans. Assumptions for |
| (6) | Represents perquisites consisting of |
| (7) | Represents 401(k) plan matching contributions. |
Employment Agreements and Severance Arrangements
Compensation arrangements, as reflected in the employment agreements with the Company’s executive officers, are usually negotiated on an individual basis between the Chief Executive Officer and each of the other executives. While the compensation committee has delegated to the Chief Executive Officer the responsibility of negotiating these employment agreements and his input is given significant consideration by the compensation committee, the compensation committee and the board have final authority over all compensation matters.
On January 27, 2006, the Company and Howard M. Lorber entered into an amended and restated employment agreement (the “Amended Lorber Agreement”), which replaced his prior employment agreements with the Company and with New Valley Corporation.Valley. The Amended Lorber Agreement had an initial term of three years effective as of January 1, 2006, with an automatic one-year extension on each anniversary of the effective date unless notice of non-extension is given by either party within 60 days before this date. Mr. Lorber’s salary is subject to an annual cost of living adjustment. As of January 1, 20162018, Mr. Lorber’s annual base salary was $3,132,4013,248,391. In addition, the Company’s board must periodically review his base salary and may increase but not decrease it from time to time in its sole discretion. Mr. Lorber is eligible on an annual basis to receive a target bonus of 100% of his base salary under the Company’s annual incentive bonus awards,awards. During the period of his employment, Mr. Lorber is entitled to various benefits, including a Company-provided car and driver, a $7,500 per month allowance for lodging and related business expenses, two club memberships and dues, and use of corporate aircraft in accordance with the Company’s Corporate Aircraft Policy. Following termination of his employment by the Company without cause (as defined in the Amended Lorber Agreement), termination of his employment by him for certain reasons specified in the Amended Lorber Agreement or upon death or disability, he (or his beneficiary in the case of death) would continue to receive for a period of 36 months following the termination date his base salary and the bonus amount earned by him for the prior year (with such bonus amount limited to 100% of base salary). In addition, except as otherwise provided in an award agreement, all of Mr. Lorber’s outstanding equity awards would be vested and any stock options granted after January 27, 2006 would continue to be exercisable for no less than two years or the remainder of the original term if shorter. Following termination of his employment for any of the reasons described above (other than death or disability) within two years after a change in control (as defined in the Amended Lorber Agreement) or before a change of control that actually occurs in anticipation of or at the request of a third party effectuating such change in control, he would receive a lump sum payment equal to 2.99 times the sum of his then current base salary and the bonus amount earned by him for the prior year (with such bonus amount limited to 100% of base salary). In addition, Mr. Lorber will be indemnified in the event that excise taxes are imposed on change-of-control payments under Section 4999 of the Code.
On January 27, 2006, the Company entered into employment agreements (the “Other Executive Agreements”) with Richard J. Lampen, the Company’s Executive Vice President, J. Bryant Kirkland III, the Company’s Senior Vice President and, effective April 1, 2006, Chief Financial Officer, and Marc N. Bell, the Company’s Senior Vice President, General Counsel and Secretary. The Other Executive Agreements replaced prior employment agreements with the Company or New Valley. The Other Executive Agreements had an initial term of two years effective as of January 1, 2006, with an automatic one-year extension on each anniversary of the effective date unless notice of non-extension is given by either party within 60 days before this date. As of January 1, 20162018, the annual base salaries provided for in these Other Executive Agreements were $900,000 for Mr. Lampen, $500,000 for Mr. Kirkland and $425,000 for Mr. Bell. In addition, the board must periodically review these base salaries and may increase but not decrease them from time to time in its sole discretion. These executives are eligible to receive a target bonus of 50% for Mr. Lampen, 33.33% for Mr. Kirkland and 25% for Mr. Bell, of their base salaries under the Company’s non-equity incentive bonus plan. Following termination of their employment by the Company without cause (as defined in the Other Executive Agreements), termination of their employment by the executives for certain reasons specified in the Other Executive Agreements or upon death or disability, they (or their beneficiaries in the case of death) would continue to receive for a period of 24 months following the termination date their base salary and the bonus amount earned by them for the prior year (with such bonus amount limited to 50% of base salary for Mr. Lampen, 33.33% of base salary for Mr. Kirkland and 25% of base salary for Mr. Bell).
On November 11, 2005, Liggett, a wholly-owned subsidiary of the Company, and Ronald J. Bernstein entered into an employment agreement (the “Bernstein Employment Agreement”), pursuant to which Mr. Bernstein serves as President and Chief Executive Officer of Liggett and affiliated companies. The Bernstein Employment Agreement had an initial term expiring December 31, 2008, with an automatic one-year extension on each anniversary of the effective date unless notice of non-extension is given by either party within six months before this date. On October 29, 2013, the Bernstein Employment Agreement was amended to increase Mr. Bernstein’s base salary, effective January 1, 2014, to $1,000,000 per annum and terminate a provision in Mr. Bernstein’s contract which granted him an automatic annual increase in base salary based on a cost of living adjustment. Under the terms of the Bernstein Employment Agreement, Mr. Bernstein is eligible on an annual basis to receive a target bonus
of up to 100% of his base salary under the Company’s non-equity incentive bonus plan if Liggett meets certain pre-established
operating goals. Following termination of his employment without cause, he would continue to receive his base salary for a period of 24 months. As of January 1, 20162018, Mr. Bernstein’s annual base salary was $1,000,000.
CEO Pay Ratio
Pursuant to Item 402(u) of Regulation S-K and Section 953(b) of the Dodd-Frank Act, presented below is the ratio of annual total compensation of the Company's CEO to the annual total compensation of the Company's median employee (excluding the CEO).
The ratio presented below is a reasonable estimate calculated in a manner consistent with Item 402(u). The SEC’s rules for identifying the median compensated employee and calculating the pay ratio based on that employee’s annual total compensation allow companies to adopt a variety of methodologies, to apply certain exclusions, and to make reasonable estimates and assumptions that reflect their employee populations and compensation practices. As a result, the pay ratio reported by other companies may not be comparable to the pay ratio reported below because other companies have different employee populations and compensation practices and may utilize different methodologies, exclusions, estimates, and assumptions in calculating their own pay ratios.
In order to estimate the Company's CEO pay ratio, the Company first determined its employee population using a determination date of October 1, 2017. It identified the median employee using a compensation measure consisting of base salary or wages (as applicable), overtime pay, and any bonuses paid during the twelve-month period preceding the determination date. Conforming adjustments were made for employees who were hired during that period and did not receive pay for the full period. The median employee from the analysis had anomalous compensation characteristics, as permitted by SEC guidances, and was substituted with another employee with substantially similar compensation (based on the compensation measure described above).
The 2017 annual total compensation as determined under Item 402 of Regulation S-K for the Company's CEO was $10,633,932, as reported in the Summary Compensation Table of this proxy statement. The 2017 annual total compensation as determined under Item 402 of Regulation S-K for the median employee was $69,597. The ratio of the Company's CEO’s annual total compensation to the Company's median employee’s annual total compensation for fiscal year 2017 is 153 to 1.
GRANTS OF PLAN-BASED AWARDS IN 20152017
The table below provides information with respect to incentive compensation granted to each of the named executive officers during the year ended December 31, 20152017.
| All Other Stock Awards: Number of Shares of Stock (#) | All Other Option Awards: Number of Shares of Securities Underlying Options (#) | Exercise or Base Price of Option Awards ($) (3) | Grant Date Fair Value of Stock and Option Awards ($) (4) | All Other Stock Awards: Number of Shares of Stock (#) | All Other Option Awards: Number of Shares of Securities Underlying Options (#) | Exercise or Base Price of Option Awards ($) (2) | Grant Date Fair Value of Stock and Option Awards ($) (3) | |||||||||||||||||||||||||||||||||||||||||||||||||||||||
Estimated Future Payouts Under Non- Equity Incentive Plan Awards(1) | Estimated Future Payouts Under Equity Incentive Plan Awards | Estimated Future Payouts Under Non- Equity Incentive Plan Awards(1) | Estimated Future Payouts Under Equity Incentive Plan Awards | |||||||||||||||||||||||||||||||||||||||||||||||||||||||||||
| Threshold | Target | Maximum | Threshold | Target | Maximum | Threshold | Target | Maximum | Threshold | Target | Maximum | |||||||||||||||||||||||||||||||||||||||||||||||||||
| Name | Grant Date | ($) | ($) | ($) | (#) | (#) (2) | (#) | Grant Date | ($) | ($) | ($) | (#) | (#) | (#) | ||||||||||||||||||||||||||||||||||||||||||||||||
| Howard M. Lorber | 2/24/2015 | — | — | — | — | — | — | — | 262,500 | $ | 22.00 | $ | 1,617,199 | 2/23/2017 | — | — | — | — | — | — | — | 262,500 | $ | 21.72 | $ | 1,348,296 | ||||||||||||||||||||||||||||||||||||
| 3/9/2015 | — | $ | 3,110,009 | $ | 3,887,511 | — | — | — | — | — | — | — | 2/23/2017 | — | $ | 3,198,494 | $ | 3,998,118 | — | — | — | — | — | — | — | |||||||||||||||||||||||||||||||||||||
| 11/10/2015 | — | — | — | — | 1,200,000 | — | — | — | — | $ | 28,374,000 | |||||||||||||||||||||||||||||||||||||||||||||||||||
| Richard J. Lampen | 2/24/2015 | — | — | — | — | — | — | — | 65,625 | $ | 22.00 | $ | 404,300 | 2/23/2017 | — | — | — | — | — | — | — | 65,625 | $ | 21.72 | $ | 337,074 | ||||||||||||||||||||||||||||||||||||
| 3/9/2015 | — | $ | 450,000 | $ | 562,500 | — | — | — | — | — | — | — | 2/23/2017 | — | $ | 450,000 | $ | 562,500 | — | — | — | — | — | — | — | |||||||||||||||||||||||||||||||||||||
| J. Bryant Kirkland III | 2/24/2015 | — | — | — | — | — | — | — | 39,375 | $ | 22.00 | $ | 302,664 | 2/23/2017 | — | — | — | — | — | — | — | 39,375 | $ | 21.72 | $ | 306,343 | ||||||||||||||||||||||||||||||||||||
| 3/9/2015 | — | $ | 106,250 | $ | 132,813 | — | — | — | — | — | — | — | 2/23/2017 | — | $ | 166,650 | $ | 208,313 | — | — | — | — | — | — | — | |||||||||||||||||||||||||||||||||||||
| Marc N. Bell | 2/24/2015 | — | — | — | — | — | — | — | — | — | — | 2/23/2017 | — | — | — | — | — | — | — | 39,375 | $ | 21.72 | $ | 306,343 | ||||||||||||||||||||||||||||||||||||||
| 3/9/2015 | — | $ | 106,250 | $ | 132,813 | — | — | — | — | 39,375 | $ | 22.00 | $ | 302,664 | 2/23/2017 | — | $ | 106,250 | $ | 132,813 | — | — | — | — | — | — | — | |||||||||||||||||||||||||||||||||||
| Ronald J. Bernstein | 3/9/2015 | — | $ | 1,000,000 | $ | 1,000,000 | — | — | — | — | — | — | — | 2/23/2017 | — | $ | 1,000,000 | $ | 1,000,000 | — | — | — | — | — | — | — | ||||||||||||||||||||||||||||||||||||
___________________________
| (1) | Represents the awards made under the |
| (2) | Represents |
| Represents the aggregate grant date fair value of |
OUTSTANDING EQUITY AWARDS AT DECEMBER 31, 20152017
The table below provides information with respect to the outstanding equity awards of the named executive officers as of December 31, 20152017.
| Option Awards | Stock Awards | Option Awards | Stock Awards | ||||||||||||||||||||||||||||||||||||||||||||||
Number of Securities Underlying Unexercised Options (#) Exercisable | Number of Securities Underlying Unexercised Options (#) Unexercisable | Equity Incentive Plan Awards: Number of Securities Underlying Unexercised Unearned Options (#) | Option Exercise Price ($) | Option Expiration Date | Number of Shares or Units of Stock That Have Not Vested (#) | Market Value of Shares or Units of Stock That Have Not Vested ($) | Equity Incentive Plan Awards: Number of Unearned Shares, Units or Other Rights That Have Not Vested (#) | Equity Incentive Plan Awards: Market or Payout Value of Unearned Shares, Units or Other Rights That Have Not Vested ($) | Number of Securities Underlying Unexercised Options (#) Exercisable | Number of Securities Underlying Unexercised Options (#) Unexercisable | Equity Incentive Plan Awards: Number of Securities Underlying Unexercised Unearned Options (#) | Option Exercise Price ($) | Option Expiration Date | Number of Shares or Units of Stock That Have Not Vested (#) | Market Value of Shares or Units of Stock That Have Not Vested ($) | Equity Incentive Plan Awards: Number of Unearned Shares, Units or Other Rights That Have Not Vested (#) | Equity Incentive Plan Awards: Market or Payout Value of Unearned Shares, Units or Other Rights That Have Not Vested ($) | ||||||||||||||||||||||||||||||||
| Name | |||||||||||||||||||||||||||||||||||||||||||||||||
| Howard M. Lorber | 1,072,076 | — | — | $10.52 | 12/3/2019 | — | — | — | — | 1,181,962 | — | — | $9.55 | 12/3/2019 | — | — | — | — | |||||||||||||||||||||||||||||||
| 510,512 | — | — | $13.52 | 1/14/2021 | — | — | — | — | 562,838 | — | — | $12.27 | 1/14/2021 | — | — | — | — | ||||||||||||||||||||||||||||||||
| — | 578,812 | (1) | — | $13.93 | 2/26/2023 | — | — | — | — | 638,139 | — | — | $12.64 | 2/26/2023 | — | — | — | — | |||||||||||||||||||||||||||||||
| — | 275,625 | (2) | — | $17.82 | 2/26/2024 | 945,000 | (4) | $ | 22,292,550 | — | — | — | 303,876 | (1) | — | $16.18 | 2/26/2024 | 694,575 | (5) | $ | 15,544,589 | — | — | ||||||||||||||||||||||||||
| — | 262,500 | (3) | — | $22.00 | 2/24/2025 | 1,200,000 | (5) | $ | 28,308,000 | — | — | — | 289,406 | (2) | — | $19.97 | 2/24/2025 | 945,002 | (6) | $ | 21,149,145 | — | — | ||||||||||||||||||||||||||
| — | 275,625 | (3) | — | $21.08 | 2/29/2026 | — | — | — | — | ||||||||||||||||||||||||||||||||||||||||
| — | 262,500 | (4) | — | $21.72 | 2/23/2027 | — | — | — | — | ||||||||||||||||||||||||||||||||||||||||
| Richard J. Lampen | 214,415 | — | — | $10.52 | 12/3/2019 | — | — | — | — | 236,391 | — | — | $9.55 | 12/3/2019 | — | — | — | — | |||||||||||||||||||||||||||||||
| 159,533 | — | — | $12.64 | 2/26/2023 | — | — | — | — | |||||||||||||||||||||||||||||||||||||||||
| — | 75,968 | (1) | — | $16.18 | 2/26/2024 | — | — | — | — | ||||||||||||||||||||||||||||||||||||||||
| — | 144,702 | (1) | — | $13.93 | 2/26/2023 | — | — | — | — | — | 72,351 | (2) | — | $19.97 | 2/24/2025 | — | — | — | — | ||||||||||||||||||||||||||||||
| — | 68,906 | (2) | — | $17.82 | 2/26/2024 | — | — | — | — | — | 68,906 | (3) | — | $21.08 | 2/29/2026 | — | — | — | — | ||||||||||||||||||||||||||||||
| — | 65,625 | (3) | — | $22.00 | 2/24/2025 | — | — | — | — | 65,625 | (4) | — | $21.72 | 2/23/2027 | — | — | — | — | |||||||||||||||||||||||||||||||
| J. Bryant Kirkland III | 107,207 | — | — | $10.52 | 12/3/2019 | — | — | — | — | 118,195 | — | — | $9.55 | 12/3/2019 | — | — | — | — | |||||||||||||||||||||||||||||||
| — | 86,821 | (1) | — | $13.93 | 2/26/2023 | — | — | — | — | 95,720 | — | — | $12.64 | 2/26/2023 | — | — | — | — | |||||||||||||||||||||||||||||||
| — | 41,343 | (2) | — | $17.82 | 2/26/2024 | — | — | — | — | — | 45,580 | (1) | — | $16.18 | 2/26/2024 | — | — | — | — | ||||||||||||||||||||||||||||||
| — | 39,375 | (3) | — | $22.00 | 2/24/2025 | — | — | — | — | — | 43,410 | (2) | — | $19.97 | 2/24/2025 | — | — | — | — | ||||||||||||||||||||||||||||||
| — | 41,343 | (3) | — | $21.08 | 2/29/2026 | — | — | — | — | ||||||||||||||||||||||||||||||||||||||||
| — | 39,375 | (4) | — | $21.72 | 2/23/2027 | — | — | — | — | — | |||||||||||||||||||||||||||||||||||||||
| Marc N. Bell | 107,207 | — | — | $10.52 | 12/3/2019 | — | — | — | — | 118,195 | — | — | $9.55 | 12/3/2019 | — | — | — | — | |||||||||||||||||||||||||||||||
| — | 57,881 | (1) | — | $13.93 | 2/26/2023 | — | — | — | — | 63,813 | — | — | $12.64 | 2/26/2023 | — | — | — | — | |||||||||||||||||||||||||||||||
| — | 41,343 | (2) | — | $17.82 | 2/26/2024 | — | — | — | — | — | 45,580 | (1) | — | $16.18 | 2/26/2024 | — | — | — | — | ||||||||||||||||||||||||||||||
| — | 39,375 | (3) | — | $22.00 | 2/24/2025 | — | — | — | — | — | 43,410 | (2) | — | $19.97 | 2/24/2025 | — | — | — | — | ||||||||||||||||||||||||||||||
| — | 41,343 | (3) | — | $21.08 | 2/29/2026 | — | — | — | — | ||||||||||||||||||||||||||||||||||||||||
| 39,375 | (4) | — | $21.72 | 2/23/2027 | — | — | — | — | |||||||||||||||||||||||||||||||||||||||||
| Ronald J. Bernstein | — | — | — | — | 10/28/2023 | 30,318 | (6) | $ | 715,202 | — | — | — | — | — | — | 10/28/2023 | 33,424 | (7) | $ | 748,029 | — | — | |||||||||||||||||||||||||||
___________________________
| (1) | These option grants |
| (2) | These option grants vest on February |
| (3) | These option grants vest on February |
| (4) |
| (5) | 173,644 shares of this restricted stock award vested on each of August 15, |
| This restricted stock award will vest upon the earlier of March 15, 2019, if Liggett's adjusted EBIT for the five years ended December 31, 2018, is more than $1.15 billion, or October 31, 2020 if the performance target is not achieved. |
OPTION EXERCISES AND STOCK VESTED IN YEAR ENDED DECEMBER 31, 20152017
The table below provides information with respect to options that were exercised or stock awards that vested during 20152017, as well as the value realized on the exercise or vesting date, based on the average of the high and low of the Company's common stock on that date.
| Option Awards | Stock Awards | Option Awards | Stock Awards | ||||||||||||||||||||||||
Number of Shares Acquired on | Value Realized on Exercise | Number of Shares Acquired | Value Realized on Vesting | Number of Shares Acquired on | Value Realized on Exercise | Number of Shares Acquired | Value Realized on Vesting | ||||||||||||||||||||
| Name | Exercise (#) | ($) | on Vesting | ($) | Exercise (#) | ($) | on Vesting | ($) | |||||||||||||||||||
| Howard M. Lorber | — | — | 150,000 | $ | 3,969,107 | — | — | 362,643 | $ | 8,583,659 | |||||||||||||||||
| Richard J. Lampen | — | — | — | — | — | — | — | — | |||||||||||||||||||
| J. Bryant Kirkland III | — | — | — | — | — | — | — | — | |||||||||||||||||||
| Marc N. Bell | — | — | — | — | — | — | — | — | |||||||||||||||||||
| Ronald J. Bernstein | 69,924 | $ | 728,542 | — | — | — | — | — | — | ||||||||||||||||||
Retirement Benefits
PENSION BENEFITS AT 20152017 FISCAL YEAR END
The table below quantifies the benefits expected to be paid from the Company’s Supplemental Retirement Plan and, in the case of Mr. Bernstein, also from Liggett’s Qualified Plan. The terms of the plans are described below the table.
Number of Years of Credited | Present Value of Accumulated | Payments During | Number of Years of Credited | Present Value of Accumulated | Payments During | |||||||||||||||
| Name | Plan Name | Service (#)(1) | Benefit ($)(2),(3) | Last Fiscal Year ($) | Plan Name | Service (#)(1) | Benefit ($)(2),(3) | Last Fiscal Year ($) | ||||||||||||
| Howard M. Lorber | Supplemental | 11 | $ | 32,886,248 | $0 | Supplemental | 11 | $ | 37,757,147 | $0 | ||||||||||
| Retirement Plan | Retirement Plan | |||||||||||||||||||
| Richard J. Lampen | Supplemental | 10 | $ | 3,889,863 | $0 | Supplemental | 10 | $ | 4,466,004 | $0 | ||||||||||
| Retirement Plan | Retirement Plan | |||||||||||||||||||
| J. Bryant Kirkland III | Supplemental | 12 | $ | 802,671 | $0 | Supplemental | 14 | $ | 1,135,747 | $0 | ||||||||||
| Retirement Plan | Retirement Plan | |||||||||||||||||||
| Marc N. Bell | Supplemental | 12 | $ | 1,472,850 | $0 | Supplemental | 14 | $ | 2,084,023 | $0 | ||||||||||
| Retirement Plan | Retirement Plan | |||||||||||||||||||
| Ronald J. Bernstein | Supplemental | 12 | $ | 6,136,917 | $0 | Supplemental | 12 | $ | 6,669,950 | $0 | ||||||||||
| Retirement Plan | Retirement Plan | |||||||||||||||||||
| Qualified Plan | 2 | $ | 54,736 | $0 | Qualified Plan | 2 | $ | 63,634 | $0 | |||||||||||
___________________________
| (1) | Equals number of years of credited service as of December 31, |
participation in the Supplemental Retirement Plan. Credited service under the Qualified Plan is based on service prior to January 1, 1994 when the Qualified Plan was frozen.
| (2) | Represents actuarial present value in accordance with the same assumptions outlined in note 11 to the Company’s audited financial statements for the year ended December 31, |
| (3) | Includes amounts which the named executive officer is not currently entitled to receive because such amounts are not vested. |
Supplemental Retirement Plan
The Supplemental Retirement Plan provides for the payment to a participant at his normal retirement date of a lump sum amount that is the actuarial equivalent of a single life annuity commencing on that date. The “normal retirement date” under the Supplemental Retirement Plan is defined as the January 1st following attainment by a participant of the later of age 60 or the completion of eight years of employment following January 1, 2002 (in the case of Messrs. Lorber and Bernstein) or January 1, 2004 (in the case of Messrs. Lampen, Kirkland and Bell).
The following table sets forth for each named executive officer his hypothetical single life annuity, his normal retirement date and his projected lump sum payment at his normal retirement date.
| Hypothetical | Normal | Lump-Sum | ||||||||
| Name | Single Life Annuity | Retirement Date | Equivalent | |||||||
| Howard M. Lorber | $ | 1,051,875 | January 1, 2010 | $ | 10,855,666 | |||||
| $ | 735,682 | January 1, 2013 | $ | 7,121,988 | ||||||
| Richard J. Lampen | $ | 250,000 | January 1, 2014 | $ | 2,625,275 | |||||
| J. Bryant Kirkland III | $ | 202,500 | January 1, 2026 | $ | 2,126,473 | |||||
| Marc N. Bell | $ | 200,000 | January 1, 2021 | $ | 2,100,220 | |||||
| Ronald J. Bernstein | $ | 438,750 | January 1, 2014 | $ | 4,607,358 | |||||
No benefits are payable under the Supplemental Retirement Plan if a named executive officer resigns without good reason before attaining his normal retirement date. In the case of a participant who becomes disabled prior to his normal retirement date or whose service is terminated without cause, the participant’s benefit consists of a pro-rata portion of the full projected retirement benefit to which he would have been entitled had he remained employed through his normal retirement date, as actuarially discounted back to the date of payment. The beneficiary of a participant who dies while working for the Company or a subsidiary (and before becoming disabled or attaining his normal retirement date) will be paid an actuarially discounted equivalent of his projected retirement benefit; conversely, a participant who retires beyond his normal retirement date will receive an actuarially increased lump sum payment to reflect the delay in payment using a post-retirement interest rate of 7.5%. The lump sum amount under the Supplemental Retirement Plan is paid six months following the named executive officer’s retirement on or after his normal retirement date or termination of employment without cause, along with interest at the prime lending rate as published in the Wall Street Journal on the lump sum amount for this six-month period.
Qualified Plan
Liggett’s salaried employees are entitled to benefits payable under its Qualified Plan based on a formula that yields an annual amount payable over the participant’s life beginning at age 65. Liggett discontinued providing additional benefits under the Qualified Plan for service on and after January 1, 1994. As of December 31, 20152017, none of the named executive officers was eligible to receive any benefits under the Qualified Plan, except for Mr. Bernstein who is entitled to a monthly benefit of $372 beginning at age 65.
Potential Termination and Change in Control Payments
The compensation payable to named executive officers upon voluntary termination, involuntary termination without cause, termination for cause, termination following a change in control and in the event of disability or death of the executive is described below.
Payments Made Upon Termination
Regardless of the manner in which a named executive officer’s employment terminates, unless terminated for cause, he or she may be entitled to receive amounts earned during his or her term of employment. Such amounts include:
unpaid base salary through the date of termination;
any accrued and unused vacation pay;
any unpaid award under the Plans2014 Plan or bonus under the Bonus2014 Plan with respect to a completed performance period;
all accrued and vested benefits under the Company’s compensation and benefit programs, including the pension plan and the Supplemental Retirement Plan; and
with respect solely to Mr. Lorber, payment by the Company of a tax gross-up for any excise taxes and related income taxes on gross-ups for benefits received upon termination of employment in connection with a change in control.
Payments Made Upon Involuntary Termination of Employment Without Cause or for Good Reason, Death or Disability
In the event of the termination of a named executive officer by the Company without cause or by the named executive officer for good reason, or upon the death or disability of a named executive officer, in addition to the benefits listed under the heading “Payments Made Upon Termination,” the named executive officer or his designated beneficiary upon his death will receive the following benefits:
with respect solely to Mr. Bernstein, a pro rata amount of any bonus award under the Bonus2014 Plan for which the performance period has not been completed based upon 100% of the target bonus amount for such period to the extent that Mr. Bernstein is terminated on or after July 1 of the applicable year and bonuses are otherwise paid to the management of Liggett for that year; and
acceleration of the vesting of his restricted shares and stock options upon death or disability.
Payments Made Upon a Change in Control
Howard M. Lorber
Mr. Lorber’s employment agreement has a “double-trigger” change in control provision: if his employment is terminated without cause or by the executiveMr. Lorber for good reason within two years after a change in control (or before a change in control that actually occurs in anticipation of or at the request of a third party effectuating such a change in control), Mr. Lorber would be entitled to receive the following severance benefits:
a lump-sum cash payment equal to 2.99 times the sum of his base salary plus the last annual bonus earned by him up(up to 100% of base salary, (includingincluding any deferred amount) for the performance period immediately preceding the date of termination;
participation by Mr. Lorber and his eligible dependents in all welfare benefit plans in which they were participating on the date of termination until the earlier of (x) the end of the employment period under his employment agreement and (y) the date that he receives equivalent coverage and benefit under the plans and programs of a subsequent employer;
continued participation at the Company’s expense for 36 months in life, disability, accident, health and medical insurance benefits substantially similar to those received by Mr. Lorber and his eligible dependents prior to such termination, subject to reduction if comparable benefits are actually received from a subsequent employer;
full vesting of his outstanding equity awards; and
termination of certain restrictive covenants in his employment agreement, including covenants not to compete and non-solicitation covenants.
Richard J. Lampen, J. Bryant Kirkland III, Marc N. Bell and Ronald J. Bernstein
While their respective employment agreements do not contain any change of control provisions, in the event of the termination of Messrs. Lampen, Kirkland, Bell and Bernstein by the Company without cause or by the named executive officer for good reason upon a change of control, such named executive officers would receive pursuant to their employment agreements the same severance benefits described in the section titled “Payments Made Upon Termination” and “Payments Made Upon Involuntary Termination of Employment Without Cause or for Good Reason, Death or Disability,” above.
Definition of Change in Control
Pursuant to the employment agreement between the Company and Mr. Lorber, a “change in control” is deemed to occur if:
a person unaffiliated with the Company acquires more than 40 percent control over its voting securities;
the individuals who, as of January 1, 2006, are members of the Company’s board of directors (the “Incumbent Board”), cease to constitute at least two-thirds of the Incumbent Board; however, a newly-elected board member that was elected or nominated by two-thirds of the Incumbent Board shall be considered a member of the Incumbent Board;
the Company’s stockholders approve a merger, consolidation or reorganization with an unrelated entity, unless the Company’s stockholders would own at least 51 percent of the voting power of the surviving entity; the individuals who were members of the Incumbent Board constitute at least a majority of the members of the board of directors of the surviving entity; and no person (other than one of the Company’s affiliates) has beneficial ownership of 40 percent or more of the combined voting power of the surviving entity’s then outstanding voting securities;
the Company’s stockholders approve a plan of complete liquidation or dissolution of the Company; or
the Company’s stockholders approve the sale or disposition of all or substantially all of the Company’s assets.
Definition of Termination for Cause
Under each of the employment agreements with Messrs. Lorber, Lampen, Kirkland and Bell, termination by the Company for “cause” is defined as:as the executive:
Under the employment agreement between Liggett and Mr. Bernstein, “cause” is defined as:
a material breach by Mr. Bernstein of his duties and obligations under his employment agreement which breach is not remedied to the satisfaction of the board of directors of Liggett (“Liggett Board”), within 30 days after receipt by Mr. Bernstein of written notice of such breach from the Liggett Board;
Mr. Bernstein’s conviction or indictment for a felony;
an act or acts of personal dishonesty by Mr. Bernstein intended to result in personal enrichment of Mr. Bernstein at the expense of the Company or any of its affiliates or any other material breach or violation of Mr. Bernstein’s fiduciary duty owed to the Company or any of its affiliates;
material violation of any Company or Liggett policy or the Company’s Code of Business Conduct and Ethics; or
any grossly negligent act or omission or any willful and deliberate misconduct by Mr. Bernstein that results, or is likely to result, in material economic, or other harm, to the Company or any of its affiliates (other than any act or omission by
Mr. Bernstein if it was taken or omitted to be done by Mr. Bernstein in good faith and with a reasonable belief that such action or omission was in the best interests of the Company).
Definition of Termination for Good Reason
Under each of the employment agreements with Messrs. Lorber, Lampen, Kirkland and Bell, termination by the executive for “good reason” is defined as:
a material diminution of the executive’s duties and responsibilities provided in his employment agreement, including, without limitation, the failure to elect or re-elect the executive to his position (including with respect solely to Mr. Lorber, his position as a member of the board) or the removal of the executive from any such position;
a reduction of the executive’s base salary or target bonus opportunity as a percentage of base salary or any other material breach of any material provision of his employment agreement by the Company;
relocation of the executive’s office from the Miami (or with respect solely to Mr. Lorber, Miami or New York City) metropolitan areas;
the change in the executive’s reporting relationship from direct reporting to the board, in the case of Mr. Lorber, to the Chairman and the Chief Executive Officer, in the case of Mr. Lampen, or to the Chairman, Chief Executive Officer or the Executive Vice President, in the case of Messrs. Kirkland and Bell; or
the failure of a successor to all or substantially all of the Company’s business or assets to promptly assume and continue his employment agreement obligations whether contractually or as a matter of law, within 15 days of such transaction.
Under the employment agreement with Mr. Bernstein, “good reason” exists if, without the prior written consent of Mr. Bernstein:
the Liggett Board removes Mr. Bernstein as President and Chief Executive Officer of Liggett, other than in connection with the termination of his employment;
Mr. Bernstein is not appointed as a member of the Liggett Board;
the Liggett Board reduces Mr. Bernstein’s rate of salary or bonus opportunity or materially reduces Mr. Bernstein’s welfare, perquisites or other benefits described in his employment agreement;
Mr. Bernstein’s duties and responsibilities at Liggett are significantly diminished or there are assigned to him duties and responsibilities materially inconsistent with his position;
Liggett fails to obtain a written agreement reasonably satisfactory to Mr. Bernstein from any successor of the Company to assume and perform his employment agreement; or
there occurs a change of control and Mr. Bernstein is required to relocate more than 50 miles from Mr. Bernstein’s current work location.
Assumptions Regarding Post-Termination Payment Tables
The following tables were prepared as though each named executive officer’s employment was terminated on December 31, 20152017 (the last business day of 2015) using the closing price of the Company’s Common Stock as of that day ($23.5922.38). The amounts under the columns which reflect a Change in Control assume that a change in control occurred on December 31, 20152017. However, the executives’ employment was not terminated on December 31, 20152017 and a change in control did not occur on that date. There can be no assurance that a termination of employment, a change in control or both would produce the same or similar results as those describedquantified below if either or both of themthese events occur on any other date or at any other price, or if any other assumption is not correctused in fact.these estimates changes based on the facts and circumstances at the time of an actual change in control or termination of employment.
Equity-Based Assumptions
Stock options held by Messrs. Lorber, Lampen, Kirkland and Bell and restricted stock held by Messrs. Lorber and Bernstein would have vested on December 31, 20152017 with respect to a change in control or termination by him on death or disability.
Stock options that become vested due to a change in control are valued based on their “spread” (i.e., the difference between the stock’s fair market value and the exercise price).
It is possible that in the case of Mr. Lorber's payments, IRS rules would require these items to be valued using a valuation method such as, with respect to stock options, the Black-Scholes model if theythe stock options were continued after a change in control. Using a Black-Scholes value in lieu of the “spread” would cause higher value for excise taxes and the related tax gross-up payment.
Incentive Plan Assumptions
All amounts under the Bonus2014 Plan were deemed to have been earned for 20152017 in full based on actual performance and are not treated as subject to the excise tax upon a change in control.
Retirement Benefit Assumptions
All benefits were assumed to be payable in a single lump sum at the participant’s assumed retirement date.
Howard M. Lorber
Termination by Company without Cause or by Named Executive Officer with Good Reason | Disability | Death | Termination by Company for Cause or Voluntary Termination by Named Executive Officer Without Good Reason | Termination by Company without Cause or by Named Executive Officer with Good Reason upon a Change in Control | Termination by Company without Cause or by Named Executive Officer with Good Reason | Disability | Death | Termination by Company for Cause or Voluntary Termination by Named Executive Officer Without Good Reason | Termination by Company without Cause or by Named Executive Officer with Good Reason upon a Change in Control | |||||||||||||||||||||||||||
| Cash Severance | $ | 18,631,221 | (1) | $ | 18,631,221 | (1) | $ | 18,631,221 | (1) | — | $ | 18,569,117 | (2) | $ | 18,992,685 | (1) | $ | 18,992,685 | (1) | $ | 18,992,685 | (1) | — | $ | 18,929,376 | (2) | ||||||||||
| Value of Accelerated Unvested Equity (3) | $ | 7,599,055 | $ | 58,199,605 | $ | 58,199,605 | — | $ | 58,199,605 | $ | 3,113,062 | $ | 46,529,026 | $ | 46,529,026 | — | $ | 46,529,026 | ||||||||||||||||||
| Benefits Continuation (4) | $ | 127,811 | $ | 127,811 | $ | 30,791 | — | $ | 127,811 | $ | 112,238 | $ | 112,238 | $ | 24,345 | — | $ | 112,238 | ||||||||||||||||||
| Value of Supplemental Retirement Plan (5) | $ | 25,524,731 | $ | 25,524,731 | $ | 25,524,731 | $25,524,731 | $ | 25,524,731 | $ | 29,497,018 | $ | 29,497,018 | $ | 29,497,018 | $29,497,018 | $ | 29,497,018 | ||||||||||||||||||
| Excise Tax and Gross-Up | — | — | — | — | $ | 37,948,911 | (6) | — | — | — | — | $ | 18,302,663 | (6) | ||||||||||||||||||||||
___________________________
| (1) | Reflects the value of the sum of Mr. Lorber’s |
| (2) | Reflects the value of the sum of Mr. Lorber’s |
| (3) | Reflects the value of any unvested stock options or restricted stock and related dividends that would have vested upon the event using the closing price of the Company’s Common Stock on December 31, |
| (4) | Reflects the value of premium payments for life insurance, medical, dental and disability plans for 36 months at the Company’s cost, based on |
| (5) | This amount includes amounts that the named executive officer accrued under the Supplemental Retirement Plan as of December 31, |
| (6) | This payment was estimated using a |
Richard J. Lampen
Termination by Company without Cause or by Named Executive Officer with Good Reason | Disability | Death | Termination by Company for Cause or Voluntary Termination by Named Executive Officer Without Good Reason | Termination by Company without Cause or by Named Executive Officer with Good Reason upon a Change in Control | Termination by Company without Cause or by Named Executive Officer with Good Reason | Disability | Death | Termination by Company for Cause or Voluntary Termination by Named Executive Officer Without Good Reason | Termination by Company without Cause or by Named Executive Officer with Good Reason upon a Change in Control | |||||||||||||||||||||||||||||
| Cash Severance (1) | $ | 2,700,000 | $ | 2,700,000 | $ | 2,700,000 | — | $ | 2,700,000 | $ | 2,700,000 | $ | 2,700,000 | $ | 2,700,000 | — | $ | 2,700,000 | ||||||||||||||||||||
| Value of Accelerated Unvested Equity (2) | $ | 1,899,753 | $ | 1,899,753 | $ | 1,899,753 | — | $ | 1,899,753 | $ | 778,259 | $ | 778,259 | $ | 778,259 | — | $ | 778,259 | ||||||||||||||||||||
| Benefits Continuation (3) | $ | 63,247 | $ | 63,247 | $ | 20,654 | — | $ | 63,247 | $ | 54,795 | $ | 54,795 | $ | 16,230 | — | $ | 54,795 | ||||||||||||||||||||
| Value of Supplemental Retirement Plan (4) | $ | 3,027,488 | $ | 3,027,488 | $ | 3,027,488 | $ | 3,027,488 | $ | 3,027,488 | $ | 3,498,641 | $ | 3,498,641 | $ | 3,498,641 | $ | 3,498,641 | $ | 3,498,641 | ||||||||||||||||||
| Excise Tax and Gross-Up | — | — | — | — | — | |||||||||||||||||||||||||||||||||
| Excise Tax and Gross-Up (not applicable) | — | — | — | — | — | |||||||||||||||||||||||||||||||||
___________________________
| (1) | Reflects the value of the sum of Mr. Lampen’s |
| (2) | Reflects the value of any unvested stock options or restricted stock and related dividends that would have vested upon the event using the closing price of the Company’s Common Stock on December 31, |
| (3) | Reflects the value of premium payments for life insurance, medical, dental and disability plans for 24 months at the Company’s cost, based on |
| (4) | This amount includes amounts that the named executive officer accrued under the Supplemental Retirement Plan as of December 31, |
J. Bryant Kirkland III
Termination by Company without Cause or by Named Executive Officer with Good Reason | Disability | Death | Termination by Company for Cause or Voluntary Termination by Named Executive Officer Without Good Reason | Termination by Company without Cause or by Named Executive Officer with Good Reason upon a Change in Control | Termination by Company without Cause or by Named Executive Officer with Good Reason | Disability | Death | Termination by Company for Cause or Voluntary Termination by Named Executive Officer Without Good Reason | Termination by Company without Cause or by Named Executive Officer with Good Reason upon a Change in Control | |||||||||||||||||||||||||
| Cash Severance (1) | $ | 1,062,500 | $ | 1,062,500 | $ | 1,062,500 | — | $ | 1,062,500 | $ | 1,333,300 | $ | 1,333,300 | $ | 1,333,300 | — | $ | 1,333,300 | ||||||||||||||||
| Value of Accelerated Unvested Equity (2) | — | $ | 1,139,846 | $ | 1,139,846 | — | $ | 1,139,846 | — | $ | 466,948 | $ | 466,948 | — | $ | 466,948 | ||||||||||||||||||
| Benefits Continuation (3) | $ | 28,765 | $ | 28,765 | — | — | $ | 28,765 | $ | 24,854 | $ | 24,854 | — | — | $ | 24,854 | ||||||||||||||||||
| Value of Supplemental Retirement Plan (4) | $ | 557,621 | $ | 557,621 | $ | 1,022,306 | — | $ | 557,621 | $ | 751,801 | $ | 751,801 | $ | 1,181,402 | — | $ | 751,801 | ||||||||||||||||
| Excise Tax and Gross-Up | — | — | — | — | — | |||||||||||||||||||||||||||||
| Excise Tax and Gross-Up (not applicable) | — | — | — | — | — | |||||||||||||||||||||||||||||
___________________________
| (1) | Reflects the value of the sum of Mr. Kirkland’s |
| (2) | Reflects the value of any unvested stock options or restricted stock and related dividends that would have vested upon the event using the closing price of the Company’s Common Stock on December 31, 2017 ($22.38). See “Outstanding Equity Awards at December 31, 2017.” |
| (3) | Reflects the value of premium payments for life insurance, medical, dental and disability plans for 24 months at the Company’s cost, based on 2017 premiums. |
| (4) | This amount includes amounts that the named executive officer accrued under the Supplemental Retirement Plan as of December 31, 2017, which are disclosed in “Pension Benefits at 2017 Fiscal Year End.” |
Marc N. Bell
Termination by Company without Cause or by Named Executive Officer with Good Reason | Disability | Death | Termination by Company for Cause or Voluntary Termination by Named Executive Officer Without Good Reason | Termination by Company without Cause or by Named Executive Officer with Good Reason upon a Change in Control | ||||||||||||||
| Cash Severance (1) | $ | 1,062,500 | $ | 1,062,500 | $ | 1,062,500 | — | $ | 1,062,500 | |||||||||
| Value of Accelerated Unvested Equity (2) | — | $ | 466,948 | $ | 466,948 | — | $ | 466,948 | ||||||||||
| Benefits Continuation (3) | $ | 59,365 | $ | 59,365 | $ | 45,362 | — | $ | 59,365 | |||||||||
| Value of Supplemental Retirement Plan (4) | $ | 1,391,271 | $ | 1,391,271 | $ | 1,689,400 | — | $ | 1,391,271 | |||||||||
| Excise Tax and Gross-Up (not applicable) | — | — | — | — | — | |||||||||||||
___________________________
| (1) | Reflects the value of the sum of Mr. Bell’s 2017 base salary ($425,000) and last paid bonus limited to 25% of base salary ($106,250) paid over a period of 24 months commencing after termination. |
| (2) | Reflects the value of any unvested stock options or restricted stock and related dividends that would have vested upon the event using the closing price of the Company’s Common Stock on December 31, |
| (3) | Reflects the value of premium payments for life insurance, medical, dental and disability plans for 24 months at the Company’s cost, based on |
| (4) | This amount includes amounts that the named executive officer accrued under the Supplemental Retirement Plan as of December 31, |
Termination by Company without Cause or by Named Executive Officer with Good Reason | Disability | Death | Termination by Company for Cause or Voluntary Termination by Named Executive Officer Without Good Reason | Termination by Company without Cause or by Named Executive Officer with Good Reason upon a Change in Control | ||||||||||||||
| Cash Severance (1) | $ | 1,062,500 | $ | 1,062,500 | $ | 1,062,500 | — | $ | 1,062,500 | |||||||||
| Value of Accelerated Unvested Equity (2) | — | $ | 860,285 | $ | 860,285 | — | $ | 860,285 | ||||||||||
| Benefits Continuation (3) | $ | 73,204 | $ | 73,204 | $ | 57,724 | — | $ | 73,204 | |||||||||
| Value of Supplemental Retirement Plan (4) | $ | 1,031,925 | $ | 1,031,925 | $ | 1,461,893 | — | $ | 1,031,925 | |||||||||
| Excise Tax and Gross-Up | — | — | — | — | — | |||||||||||||
Ronald J. Bernstein
Termination by Company without Cause or by Named Executive Officer with Good Reason | Disability | Death | Termination by Company for Cause or Voluntary Termination by Named Executive Officer Without Good Reason | Termination by Company without Cause or by Named Executive Officer with Good Reason upon a Change in Control | Termination by Company without Cause or by Named Executive Officer with Good Reason | Disability | Death | Termination by Company for Cause or Voluntary Termination by Named Executive Officer Without Good Reason | Termination by Company without Cause or by Named Executive Officer with Good Reason upon a Change in Control | |||||||||||||||||||||||||||||
| Cash Severance (1) | $ | 2,000,000 | $ | 2,000,000 | $ | 1,000,000 | — | $ | 2,000,000 | $ | 2,000,000 | $ | 2,000,000 | $ | 1,000,000 | — | $ | 2,000,000 | ||||||||||||||||||||
| Value of Accelerated Unvested Equity (2) | — | $ | 715,202 | $ | 715,202 | — | $ | 715,202 | — | $ | 748,029 | $ | 748,029 | — | $ | 748,029 | ||||||||||||||||||||||
| Benefits Continuation (3) | $ | 60,917 | $ | 60,917 | $ | 19,440 | — | $ | 60,917 | $ | 60,917 | $ | 60,917 | $ | 16,230 | — | $ | 60,917 | ||||||||||||||||||||
| Value of Retirement Benefits (4) | $ | 5,260,248 | $ | 5,260,248 | $ | 5,260,248 | $ | 5,260,248 | $ | 5,260,248 | $ | 6,078,874 | $ | 6,078,874 | $ | 6,078,874 | $ | 6,078,874 | $ | 6,078,874 | ||||||||||||||||||
| Excise Tax and Gross-Up | — | — | — | — | — | |||||||||||||||||||||||||||||||||
| Excise Tax and Gross-Up (not applicable) | — | — | — | — | — | |||||||||||||||||||||||||||||||||
___________________________
| (1) | Reflects the value of the sum of Mr. Bernstein’s |
| (2) | Reflects the value of any unvested stock options or restricted stock and related dividends that would have vested upon the event using the closing price of the Company’s Common Stock on December 31, |
| (3) | Reflects the value of premium payments for life insurance, medical, dental and disability plans for 24 months at the Company’s cost, based on |
| (4) | This amount includes amounts that the named executive officer accrued under the Supplement Retirement Plan as of December 31, |
Compensation of Directors
The compensation of the non-employee directors is designed to be simple and easy for stockholders to understand and to be fair based on the amount of work required of directors of the Company. Each of the non-employee directors receives:
annual cash retainer fee of $50,000;
$2,500 per annum for each committee membership ($5,000 for the committee chairman);
$1,000 per meeting for each board meeting attended in person or by telephone;
$500 per meeting for each committee meeting attended in person or by telephone;
periodic grants of restricted shares;
reimbursement for reasonable out-of-pocket expenses incurred in serving on the Company's board; and
access to and payment for the Company's health, dental and standard life insurance coverage.
No stock options to purchase Common Stock shares of Common Stock or other equity-based awardsthe Company were granted to the non-employee directors in 2015.2017. During the second quarter of 2016, the Company intends to grantgranted 10,000 restricted shares (prior to adjustment for subsequent stock dividends) of Common Stock under the 2014 Plan to each of its non-employee directors in order to align the director's interests with the long-term interests of the stockholders. The stock grant, is expected to vestincluding any accumulated dividends, vests in three equal annual installments commencing on the first anniversary of the date of grant based on continued service as a director, subject to earlier vesting upon death, disability or the occurrence of a change in control.
The table below summarizes the compensation the Company paid to the non-employee directors for the year ended December 31, 20152017.
NON-EMPLOYEE DIRECTOR COMPENSATION IN FISCAL YEAR 20152017
Fees Earned or Paid in Cash | Stock Awards | All Other Compensation | Total | Fees Earned or Paid in Cash | Stock Awards | All Other Compensation | Total | ||||||||||||||||||||||||||
| Name | ($) | ($) | ($) | ($) | ($) | ($) | ($) | ($) | |||||||||||||||||||||||||
| Stanley S. Arkin (4) | $ | 65,375 | — | $ | 3,312 | (1) | $ | 68,687 | $ | 63,000 | $ | — | $ | 3,312 | (1) | $ | 66,312 | ||||||||||||||||
| Henry C. Beinstein (4) | $ | 83,125 | — | $ | 2,497 | (1) | $ | 85,622 | $ | 69,500 | $ | — | $ | 2,497 | (1) | $ | 71,997 | ||||||||||||||||
| Bennett S. LeBow (4) | $ | 61,500 | — | $ | 55,734 | (2) | $ | 117,234 | $ | 57,500 | $ | — | $ | 55,734 | (2) | $ | 113,234 | ||||||||||||||||
| Jeffrey S. Podell (4) | $ | 81,500 | — | $ | 2,447 | (1) | $ | 83,947 | $ | 70,500 | $ | — | $ | 2,447 | (1) | $ | 72,947 | ||||||||||||||||
| Jean E. Sharpe (4) | $ | 85,000 | — | $ | 11,124 | (3) | $ | 96,124 | $ | 74,000 | $ | — | $ | 69,064 | (3) | $ | 143,064 | ||||||||||||||||
___________________________
| (1) | Represents life insurance premiums paid by the Company. |
| (2) | Represents health and life insurance premiums of $35,043 and $20,691, respectively, paid by the Company. |
| (3) | Represents personal use of Company aircraft of $58,776, health insurance premiums of $7,223 and life insurance premiums of $3,065 paid by the Company. |
| (4) | Held |
| (5) | Paul V. Carlucci and Barry Watkins, who are independent non-employee directors, were appointed to the Board in 2018 and did not receive director compensation in 2017. |
Compensation Committee Interlocks and Insider Participation
No member of the Company’s compensation committee is, or has been, an employee or officer of the Company other than Ms. Sharpe who joined the compensation committee in March 2009. Ms. Sharpe retired as an officer of the Company in 1993. During 20152017, (i) no member of the Company’s compensation committee had any relationship with the Company requiring disclosure under Item 404 of Regulation S-K; and (ii) none of the Company’s executive officers served on the compensation committee (or equivalent) or board of directors of another entity whose executive officer(s) served on the Company’s compensation committee or board of directors.
Audit Committee Report
Management is responsible for the Company’s internal controlsfinancial statements and the financial reporting process, including the systems of internal controls over financial reporting. The audit committee's role is to oversee the Company's accounting and financial reporting processes and audits of financial statements. In 2016, we assisted the Board in its financial statements and management’s assessmentoversight of the effectivenessCompany's compliance with legal and regulatory requirements, the independent registered public accounting firm's qualifications, independence and performance, the oversight of the Company’sCompany's internal control over financial reporting.audit function and the Company's risk assessment and its risk management guidelines and policies.
The audit committee oversees the Company's management, the internal audit function and Deloitte & Touche LLP ("Deloitte"(“Deloitte”), the Company's independent registered public accounting firmfirm. Management is responsible for preparing the Company's consolidated financial statements in accordance with generally accepted accounting principles in the United States (“U.S. GAAP”), assessing and establishing effective financial reporting systems and internal controls and procedures and reporting on the effectiveness of the Corporation's internal controls over financial reporting. The internal audit function is responsible for assessing management's system of internal controls and procedures and reporting on the effectiveness of that system. Deloitte is responsible for auditing the Company's consolidated financial statements, issuing an opinion about whether such statements conform with U.S. GAAP and auditing the effectiveness of the Company's Internal Control over financial reporting.
Periodically, the audit committee meets, both independently and collectively, with management, the internal auditors and the independent registered public accountant, to discuss the quality of the Company's accounting and financial reporting processes and the adequacy and effectiveness of internal controls and procedures and to review significant audit findings prepared by the public accountants and the internal auditors, together with management's responses and review the overall scope and plans for audits.
Prior to the Company's filing of its annual report on Form 10-K for the year ended December 31, 2015,2017 with the SEC, the audit committee also reviewed and PricewaterhouseCoopers LLP ("PwC"),discussed the Company’s independent registered certified public accounting firm for the years ended December 31, 2014 and 2013, issue opinions on the conformity of the Company’s audited financial statements with generally accepted accounting principles and on the effectiveness of the Company’s internal control over financial reporting. The audit committee reviews these processes on behalf of the board of directors. In this context, the committee has reviewed and discussed with management and Deloitte the audited financial statements for the year ended December 31, 2015, management’s assessment of the effectiveness of the Company’s internal control over financial reporting and the evaluation by Deloitte of the effectiveness of the Company’s internal control over financial reporting.
Based on the review and discussions referred to above, the audit committee recommended to the board of directors that the audited financial statements and management’s assessment of the effectiveness of the Company’s internal control over financial reporting be included in the Company’s Annual Report on Form 10-K for the year ended December 31, 20152017 filed with the Securities and Exchange Commission.SEC.
This report is submitted by the audit committee of the Company.
| Henry C. Beinstein, Chairman | |
| Jeffrey S. Podell | |
| Jean E. Sharpe | |
Audit and Non-Audit Fees
The audit committee reviews and approves audit and permissible non-audit services performed by Deloitte, and PwC, as well as the fees charged by Deloitte and PwC for such services. In accordance with Section 10A(i) of the Securities Exchange Act, before Deloitte and PwC are engaged to render audit or non-audit services, the engagement is approved by the audit committee. All of the services provided and fees charged by each of Deloitte and PwC in 20152017 and PwC in 20142016 were pre-approved by the audit committee.
Pre-Approval Policies and Procedures
Procedures. The audit committee has adopted a policy that requires advance approval of all audit, audit-related, tax and other services performed by the independent registered certified public accounting firms. The policy provides for pre-approval by the audit committee of specifically defined audit and non-audit services. Unless the specific service has been previously pre-approved with respect to that year, the audit committee must approve the permitted service before any independent registered certified public accounting firm is engaged to perform it. The audit committee approved all services provided by Deloitte in 2017.
Audit Fees. The aggregate fees billed by Deloitte for professional services for the audit of the annual financial statements of the Company and PwCits consolidated subsidiaries, audit of effectiveness of internal control over financial reporting under Sarbanes-Oxley Section 404, audits of subsidiary financial statements, reviews of the financial statements included in 2015.the Company’s quarterly reports on Form 10-Q, comfort letters, consents and review of documents filed with the SEC were $4,371,200 for 2017 and
$3,659,200 for 2016. The Company believes that additional amounts may be billed for audit services rendered in 2017 but no invoice has been submitted for approval to either the Company or the audit committee as of the date of this proxy statement.
Audit-Related Fees. The aggregate fees billed by Deloitte for professional services for audit-related fees were $110,208 in 2017 and $72,395 for 2016. The audit-related fees related to assistance with Accounting Standards Codification 606, Revenue from Contracts with Customers which is effective January 1, 2018.
Tax Fees. The aggregate fees billed by Deloitte for professional services for tax services were $82,200 in 2017 and $15,600 for 2016. The services were for federal tax advice.
All Other Fees. The aggregate fees billed for other services by Deloitte were $7,580 in 2017 and $7,600 in 2016, respectively. The amounts consisted of licensing of accounting research software.
Equity Compensation Plan Information
The following table summarizes information about the options, warrants and rights and other equity compensation under the Company’s equity plans as of December 31, 20152017.
Number of securities to be issued upon exercise of outstanding options, warrants and rights | Weighted-average exercise price of outstanding options, warrants and rights | Number of securities remaining available for future issuance under equity compensation plans (2) | Number of securities to be issued upon exercise of outstanding options, warrants and rights | Weighted-average exercise price of outstanding options, warrants and rights | Number of securities remaining available for future issuance under equity compensation plans (2) | |||||
| Plan Category | ||||||||||
| Equity compensation plans approved by security holders (1) | 3,745,631 | $13.82 | 7,888,406 | 4,928,459 | $14.05 | 7,807,749 | ||||
| Equity compensation plans not approved by security holders | — | — | — | — | — | — | ||||
| Total | 3,745,631 | $13.82 | 7,888,406 | 4,928,459 | $14.05 | 7,807,749 | ||||
___________________________
| (1) | Includes options to purchase shares of the Company’s Common Stock under the following stockholder-approved plans: 1999 Plan and 2014 Plan. |
| (2) | Excluding securities reflected in second column. |
Certain Relationships and Related Party Transactions
The board of directors has adopted a written policy for the review and approval of transactions between the Company and its directors, director nominees, executive officers, greater than five percentgreater-than-five-percent beneficial owners and their immediate family members. The policy covers any related party transaction that meets the minimum threshold for disclosure in the Company’s proxy statement under the relevant Securities and Exchange CommissionSEC rules. The audit committee is responsible for reviewing and, if appropriate, approving or ratifying any related party transactions. In determining whether to approve, disapprove or ratify a related party transaction, the audit committee will take into account, among other factors it deems appropriate, (i) whether the transaction is on terms no less favorable to the Company than terms that would have been reached with an unrelated third party, (ii) the extent of the interest of the related party in the transaction and (iii) the purpose and the potential benefits to the Company of the transaction.
The related party transactions described in this proxy statement entered into before this policy was adopted were approved by the board of directors or the audit committee.
The Company beneficially owns approximately 8% of the common stock of Ladenburg Thalmann Financial Services Inc. (“LTS”)(NYSE American: LTS), and certain executive officers and directors of the Company serve as officers and members of the Board of Directors of LTS. At December 31, 2017, the Company owned 15,191,205 LTS common shares and received dividends on those shares of $303,824 in 2017. The Company also owns shares 240,000 shares of LTS 8% Series A Preferred Stock and received dividends on these shares of $480,096 in 2017. Since September 2006, the Company has had an agreement with LTS, as subsequently amended, pursuant to which it agreed to make available to LTS the services of Mr. Lampen, the Company's Executive Vice President, to serve as the President and Chief Executive Officer of LTS and to provide certain other financial, accounting and tax services, including assistance with complying with Section 404 of the Sarbanes-Oxley Act of 2002 and assistance in the preparation of income tax returns. LTS paid the Company $850,000 in 20152017 and the agreement has continued in 2016.2018. The agreement is terminable by either party upon 30 days’ prior written notice. LTS paid bonus compensation for 20152017 of $1,300,000$1,425,000 to each of
Mr. Lorber, who serves as Vice Chairman of LTS, and Mr. Lampen, who serves as President, Chief Executive Officer and as a director of LTS. Mr. Lampen is being reimbursed by LTS for various automobile expenses and health and dental insurance premiums on an after-tax basis ($31,66883,092 for 2015)2017), and receivesreceived in 2017 a base salary of $150,000$200,000 from LTS in 2015, which is $200,000,($250,000, effective January 1, 2016.2018). Mr. Lorber also received customary director's fees of $36,000$53,000 from LTS in 2015. On November 4, 2011, the Company was part of a consortium, which included Dr. Frost and Mr. Lampen, that entered into a loan agreement with LTS. The total amount lent to LTS was $165,000,000 and Vector’s portion of the loan was $15,000,000. Interest on the loan is payable quarterly by LTS at 11% per annum, commenced on December 31, 2011, and is due November 4, 2016. The Company recorded interest income of $279,715 for the year ended December 31, 2015. At March 25, 2016, the balance of the Company’s portion of the loan was $1,680,000 from LTS.2017. Dr. Phillip Frost, who is a more than 10% stockholder of the Company's Common Stock as of the record date, is Chairman of LTS's Board of Directors and beneficially owns more than 10% of LTS.
The Company beneficially owns approximately 8% of Castle.Castle Brands Inc. (NYSE American: ROX). Mr. Lampen serves as Castle's President and Chief Executive Officer and Henry C. Beinstein, a member of the Company's Board of Directors, serves as a director of Castle. In October 2008, Vector entered into an agreement with Castle where the Company agreed to make available the services of Mr. Lampen to serve as the President and Chief Executive Officer of Castle as well as other financial, accounting and tax services. Vector recognized management fees of $100,000 in 20152017 under the agreement and Castle is paying the Company management fees of $100,000 per year in 2016. The2018. Mr. Lampen received from Castle a retention payment of $400,000 in June 2017, vesting over a two-year period. In February 2018, the Company ownsconverted $200,000 of Castle convertible debt, which bearsbore interest at 5% per annum, due in 2018.into 223,859 common shares of Castle. The Company recorded interest income of $10,000 from the notes for the year ended December 31, 2015. The notes are convertible into2017. Dr. Frost is a director of Castle shares at $0.90 per share.and beneficially owns more than 10% of Castle.
In addition to its interests in LTS and Castle, the Company has investments in other entities where Dr. Frost has a relationship. These include: (i) five investments in 2006, 2008, 2009, 2011 and 2015 totaling approximately $19,493,322 in common stock of OPKO Inc. (NYSE:(NASDAQ: OPK) and another $5,000,000 in OPKO convertible bonds in 2013 (in OPKO convertible bonds through the Company’s Accommodations Acquisition Corp ("AAC"(“Opko”) subsidiary); (ii) a $500,000an investment in 2008 for 2,259,796 shares inof BioCardia Inc. (formerly known as Tiger X Medical Inc. (formerly known asand Cardo Medical Inc. (OTC BB: CDOM)(OTC: BCDA)) (“BioCarda”); and (iii) a $250,000 investment in 2008, a $125,000 investment in 2010 and a $200,000 investment in 2015investments in Cocrystal Discovery Inc. (OTC BB:(OTCQB: COCP). Dr. Frost is the principal shareholder, Chairman of the Board and CEO of Opko, a director executive officer and/orand more than 10% stockholdershareholder of OPKOCoCrystal and other entities in which the Company has invested as well such as LTS, Castle and CoCrystal.principal shareholder of BioCardia. Additional investments in entities where Dr. Frost has a relationship may be made in the future.
In September 2012, the Company entered into an office lease (the “Initial Lease”) with Frost Real Estate Holdings, LLC (“FREH”), an entity affiliated with Dr. Frost. The lease isFrost for 12,390 square feet of space in an office building in Miami, Florida. The initial term of the lease is five years, subject toInitial Lease commenced May 1, 2013 and included two optional five-year term extensions. Payments underDuring 2017, the Company exercised the first option to extend the lease commenced in May 2013.for five years until April 30, 2023 (the “Extended Lease”). The lease providesInitial Lease provided for payments of $30,975 per month in the first year increasing to $35,202 per month in the fifth year, plus applicable sales tax. The Extended lease provides for payments from $36,346 per month in the first year increasing to $41,307 per month in the fifth year, plus applicable sales tax. The rent includesis inclusive of operating, expenses, property taxes and general parking. A $220,000 tenant improvement allowance will be
Mr. Lorber serves as a consultant and a 50% owner of Open Acq LLC. During 2015,2017, Mr. Lorber and Open Acq LLC and its affiliates received ordinary and customary insurance commissions aggregating approximately $225,290$248,518 on various insurance policies issued for the Company and its subsidiaries and investees. Open Acq LLC and its affiliates have continued to provide services to the Company in 2015.2017.
Mr. Kirkland serves as Chairman of the Board of Directors and as President and Chief Executive Officer of Multi Solutions, II, Inc., an approximately 53%-owned subsidiary of the Company. The Company has entered into a $450,000 credit facility, as amended, with Multi Solutions II, Inc. and, as of December 31, 2015,2017, had advanced $309,197$369,196 under the facility, which bears interest at 11% per annum.annum and is due December 31, 2019. As of December 31, 2015,2017, there was accrued interest on the facility due to the Company by Multi Solutions II, Inc. of $90,209.$162,563.
Mr. Kirkland serves as Chairman of the Board of Directors and as President and Chief Executive Officer of Multi Soft, II, Inc. (OTC BB: MSOF), an approximately 54%-owned subsidiary of the Company. The Company has entered into a $450,000 credit facility, as amended, with Multi Soft II, Inc. and, as of December 31, 2015,2017, had advanced $300,157$360,157 under the facility, which bears interest at 11% per annum.annum and is due December 31, 2019. As of December 31, 2015,2017, there was accrued interest on the facility due to the Company by Multi Soft II, Inc. of $85,357.$155,778.
BOARD PROPOSAL 2 — ADVISORY VOTE ON EXECUTIVE COMPENSATION (THE SAY ON PAY VOTE)
Pursuant to Section 14A of the Securities Exchange Act of 1934, as amended, the Company is seeking a non-binding advisory vote from its stockholders regarding the compensation of its named executive officers as described in the “Compensation Discussion and Analysis” and the Summary Compensation Table. This proposal is also referred to as the say on pay vote.
The Company has designed its compensation programs to reward employees for producing sustainable growth and profitability, to attract and retain high caliber talent and to align compensation with the long-term interests of its stockholders. The Company believes that its compensation policies and procedures are centered on a pay-for-performance philosophy. In deciding how to vote on this proposal, the board urges you to consider the following factors, which are more fully discussed in the “Compensation Discussion and Analysis”:
A substantial portion of direct compensation shown in the Summary Compensation Table is variable (and therefore at risk) depending on performance (in 2015: 91.5%2016: 60.6% in the case of Mr. Lorber, 50.2%48.3% in the case of Mr. Lampen, 52.1%49.6% in the case of Mr. Kirkland, 61.2%50.0% in the case of Mr. Bell and 50.0% in the case of Mr. Bernstein). (Direct compensation includes total compensation reported in the Summary Compensation Table excluding the change in pension value.)
The Company mitigates the risks associated with incentive compensation by using multiple performance targets, caps on potential incentive payments and a clawback policy.
In 2013, the Company began to increase its focus on long-term incentives by awarding options with four-year cliff vesting and long-term performance based restricted stock. As a result, long-term equity compensation accounted for a significant portion of direct compensation shown in the Summary Compensation Table (70.5%(12.7% in the case of Mr. Lorber, 17.4%16.9% in the case of Mr. Lampen, 33.3%25.8% in the case of Mr. Kirkland and 21.3%25.5% in the case of Mr. Bell.
In addition to promoting retention of equity by vesting equity over time, the Company requires executives to retain 25% of equity awards under its Equity Retention Policy and encourages the accumulation of equity through its Equity Ownership Guidelines, all of which works to align the interests of executives with those of stockholders.
The Company’s quarterly dividend (resulting in quarterly dividends of $0.40 per share in 2015)2017) paid to all stockholders is contingent on strong financial performance achieved by the named executive officers, as well as the Company’s ability to receive dividends from its subsidiaries and investees. The incentive compensation of four of the five named executive officers is directly tied to the amount of dividends paid to stockholders: 37.5% of the performance criteria for earning the annual incentive bonus is based on distributions to stockholders.
Executives are prohibited from hedging their company securities.
The Company does not reprice options or change performance targets for annual, long-term or equity-based awards after the awards are established.
The Company requires both a change in control and a termination of employment (a “double trigger”) before cash severance payments will be made as a result of a change in control.
The compensation committee considers the advice of an independent compensation consultant in making compensation determinations.
The Board recommends that stockholders vote FOR the following resolution:
“RESOLVED, that the stockholders approve, on an advisory basis, the compensation of the Company’s named executive officers, as disclosed in the March 25, 201612, 2018 proxy statement, including the Compensation Discussion and Analysis, the executive compensation tables, and the related narrative.”
Because your vote is advisory, it will not be binding upon the board of directors of the Company, meaning that prior compensation determinations of the board will not be invalidated and the board will not be required to adjust executive compensation programs or policies as a result of the outcome of the vote. However, the board values stockholders’ opinions and the compensation committee will take into account the outcome of the vote when considering future executive compensation arrangements and corporate governance measures.
Approval of the say on pay resolution requires the affirmative vote of a majority of the shares of Common Stock present in person or represented by proxy at the annual meeting and entitled to vote on the matter.
The Company currently submits an advisory vote on executive compensation to its stockholders annually.each year. The next say-on-paysuch vote will occurbe at the 20172019 annual meeting of stockholders.
The Board of Directors recommends that stockholders vote
“FOR”
advisory approval of the Company's executive compensation.
BOARD PROPOSAL 3 — RATIFICATION OF APPOINTMENT OF INDEPENDENT REGISTERED PUBLIC ACCOUNTING FIRM
The Company asks that stockholders ratify the appointment of Deloitte & Touche LLP, which has been the independent registered public accounting firm for the Company since June 2015, as its independent registered public accounting firm for the year ending December 31, 20162018. It is expected that one or more representatives of such firm will attend the annual meeting and be available to respond to any questions. These representatives will be given an opportunity to make statements at the annual meeting if they desire.
If the appointment is not ratified, the adverse vote will be considered as an indication to the audit committee that it should consider selecting another independent registered public accounting firm for the following fiscal year. Even if the selection is ratified, the Company’s audit committee, in its discretion, may select a new independent registered public accounting firm at any time during the year if it believes that such a change would be in its best interest.
Approval of the ratification of the appointment of Deloitte as the Company’s independent registered public accounting firm for the year ending December 31, 20162018 requires the affirmative vote of the majority of shares of Common Stock present or represented, and entitled to vote thereon, at the annual meeting.
The Board of Directors recommends that stockholders vote “FOR” Proposal 3 to ratify the appointment of Deloitte & Touche LLP as the Company's independent registered public accounting firm for the year ending December 31, 2016.2018.
PROPOSAL 4 - ADVISORY VOTE ON SHAREHOLDER PROPOSAL REGARDING PROXY ACCESS BY-LAW
The Company has received the following proposal from Kenneth Steiner, 14 Stoner Avenue, Apartment 2M, Great Neck, NY 11021. Mr. Steiner has owned more than 500 shares of our common stock for more than one year.
1.Nominating shareholders or shareholder groups must beneficially own 3% or more of the Company's outstanding common stock continuously for at least three years and pledge to hold such stock through the annual meeting.
3.The number of shareholder-nominated candidates appearingeligible to appear in proxy materials should not exceedshall be one quarter of the directors then serving or two, whichever is greater. This bylaw should supplement existing rights under Company bylaws, providing that a Nominator must:
5.No limitation shall be placed on the re-nomination of shareholder nominees by Nominators based on the number or re-nominations.
percentage of votes received in any election.
7.Loaned securities shall be counted as belonging to a nominating shareholder if the shareholder represents it has the legal right to recall those securities for voting purposes and will hold those securities through the date of the annual meeting.
Proxy Accessaccess for shareholders enables shareholders to put competing director candidates on the company ballot to see if they can get more votes than some of management's director candidates. A competitive election is good for everyone. This proposal can help ensue (sic) that our management will nominate directors with outstanding qualifications after 2018 in the United States: Revisiting the Proposed SEC Rule), order to avoid giving shareholders a cost benefit analysis by the CFA Institute (Chartered Financial Analyst), foundgood reason to exercise their right to use proxy access would "benefit both the markets and corporate boardrooms, with little cost or disruption," raising US market capitalization by up to $140 billion.access.
This is particularly true when we had 2 directors at age 80. Plus 2 other directors received 4-times as many negative votes as their colleagues. We may have a board refreshment problem with 2 directors exceeding 23 and 31 years long-tenure.
Thanks are due to the shareholders who voted their 39 million shares in favor of this proposal topic at Vector Group in 2016. These 39 million yes-votes represent a substantial majority of the independent shares of Vector. These shareholders can again vote their shares in favor of this proposal topic which has been adopted by more than 100 Fortune 500 companies since 2016. These shareholders can also encourage their friends and colleagues to vote in favor of this proposal.
Proxy access, put forth by this shareholder proposal, is a low-cost method to improve company performance - especially compared to our $3 billion investment in Vector Group.
Please vote to enhance shareholder value Shareholder Proxy Access - Proposal 4"value:
BOARD OF DIRECTORS’ RESPONSE
THE BOARD OF DIRECTORS OPPOSES THE PROPOSED RESOLUTION ANDUNANIMOUSLY RECOMMENDS A VOTE AGAINST ITEM 4 FOR THE FOLLOWING REASONS:
The Company is committed to sound corporate governance policies and practices that enhance stockholder returns. The board’s Corporate Governancecorporate governance and Nominating Committeenominating committee has an existing and effective process for identifying and recommending qualified director nominees, including nominees who are recommended by stockholders. After careful consideration, the Company’s Board of Directors believes that the proposed form of “proxy access” is not in the best interests of stockholders for the following reasons:
Proxy access can result in an inexperienced, fragmented, and unstable board, which could have detrimental effects
on the Company’s business and results of operations, especially given the complex and diversified nature of the Company’s tobacco and real estate businesses;
The existing corporate governance structure is best suited to evaluate qualified director candidates;
The Company’s existing corporate governance structure already provides the opportunity for stockholder input into the governance process. Stockholders can correspond directly with the board and its individual directors. Stockholders have the opportunity to solicit proxies for their own nominees for election of directors and present proposals for inclusion in the proxy and presentation at the annual meeting of stockholders.
As a result, the Company’s stockholders rejected a similar proposal from the same stockholder at its 2016 Annual Meeting by vote of 47.8 million to 39.2 million (54.95% to 45.05%).
Implementation of the Proposal May Result in an Inexperienced and Fragmented Board for a Complex and Diversified Company
The Company operates in two very complex industries - tobacco and real estate. The Company’s tobacco segment requires an understanding of, and the ability to provide management with direction on, an intensely competitive industry which faces both complex litigation and regulatory issues while managing declining unit sales. Similarly, the Company’s real estate segment requires a specialized knowledge of a cyclical business.business as well as each regional market in which its real estate segment operates. The board believes that managing such a complex and diversified company requires identifying a diverse and highly skilled group of directors in order to effectively manage the Company’s businesses in light of the challenges the Company faces. However, the board believes that proxy access may lead to an inexperienced, fragmented and unstable board that is less efficient in managing the complexities of the Company’s businesses or less focused on creating long-term value for the Company’s stockholders.
Thus, implementation of proxy access on the terms of the proposal could threaten the Company’s focus on increasing stockholder value. The Company’s long-term approach on creatingto create stockholder value has resulted in consistent and superior long-term stockholder returns. The following table reports the Company’s total annual stockholder returns (including share price appreciation and reinvestment of cash dividends and distributions) for the three, five and ten years ended December 31, 2015.2017.